605
        
        
          Technical Committee 102 /


            Comité technique 102


          0
        
        
          5
        
        
          10
        
        
          15
        
        
          20
        
        
          5
        
        
          6
        
        
          7
        
        
          8
        
        
          9
        
        
          10
        
        
          11
        
        
          q
        
        
          t
        
        
          (MPa)
        
        
          Depth (m)
        
        
          60 mm/s
        
        
          0.5 mm/s
        
        
          Figure 3 Comparison of the smoothed cone resistance conducted with a
        
        
          penetration rate of 60 and 0.5 mm/s. The figure contains results from 3
        
        
          CPTs test for each penetration rate.
        
        
          0 20 40 60 80 100 120 140 160 180
        
        
          5
        
        
          6
        
        
          7
        
        
          8
        
        
          9
        
        
          10
        
        
          11
        
        
          f
        
        
          s
        
        
          (kPa)
        
        
          Depth (m)
        
        
          60 mm/s
        
        
          0.5 mm/s
        
        
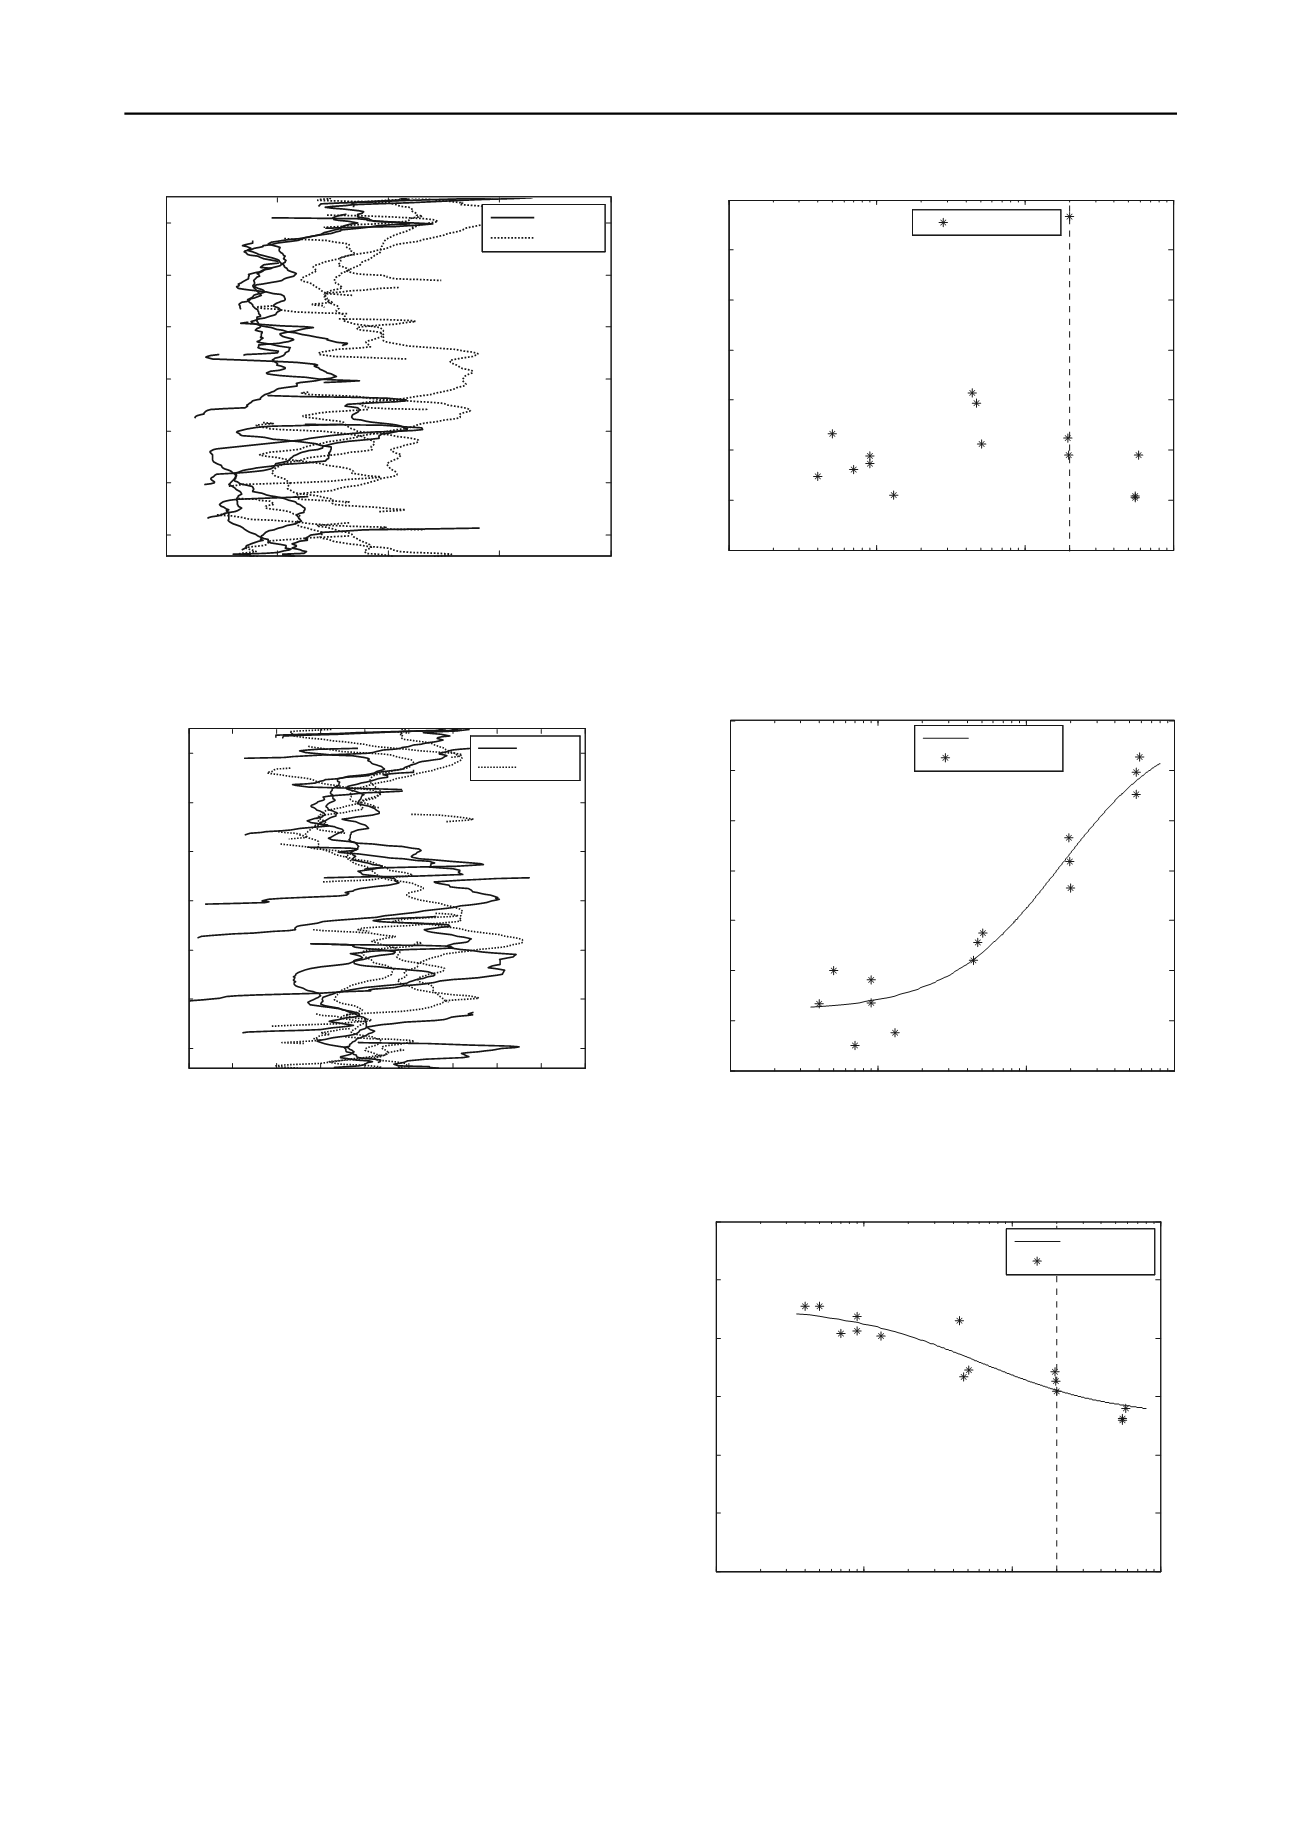
          Figure 4. Comparison of the smoothed sleeve friction conducted with a
        
        
          penetration rate of 60 and 0.5 mm/s. The figure contains results from 3
        
        
          CPTs test for each penetration rate.
        
        
          4 CORRELATION BETWEEN PENETRATION RATE
        
        
          AND MEASURED PARAMETERS
        
        
          The order of the change in the cone penetrations parameters that
        
        
          can be anticipated is however difficult to read from Figure 2,
        
        
          Figure 3 and Figure 4. As a result, the mean value of the entire
        
        
          silt layer from all CPTs (CPTs with penetration rate of 60, 20, 5,
        
        
          1 and 0.5 mm/s) can be plotted in a semi logarithmic plot. This
        
        
          has been done for the sleeve friction in Figure 5.
        
        
          Just as Figure 4, Figure 5 does not show any correlation
        
        
          between the mean sleeve friction and the mean penetration rate.
        
        
          According to Lunne et al. (1997) the sleeve friction does not
        
        
          give consistent results during cone penetration. The results
        
        
          shown in Figure 4 and Figure 5 substantiate this, for which
        
        
          reason caution must be taken when using the sleeve friction to
        
        
          analyse CPT data.
        
        
          The mean value for the pore pressure and cone resistance
        
        
          plotted against the mean penetration rate in a semi logarithmic
        
        
          plot is seen in Figure 6 and Figure 7. It can be seen that a
        
        
          correlation between the pore pressure and the penetration rate
        
        
          (Figure 6) and cone resistance and the penetration rate (Figure
        
        
          7) exist.
        
        
          0.1
        
        
          1
        
        
          10
        
        
          100
        
        
          70
        
        
          80
        
        
          90
        
        
          100
        
        
          110
        
        
          120
        
        
          130
        
        
          140
        
        
          Penetration rate (mm/s)
        
        
          f
        
        
          s
        
        
          (kPa)
        
        
          Mean values
        
        
          Figure 5. The mean sleeve friction plotted against the mean penetration
        
        
          rate from 4.5 to 11.4 m below ground level. No correlation seems to
        
        
          exist. The standard rate of penetration of 20 mm/s has been marked with
        
        
          a dotted line.
        
        
          0.1
        
        
          1
        
        
          10
        
        
          100
        
        
          0
        
        
          50
        
        
          100
        
        
          150
        
        
          200
        
        
          250
        
        
          300
        
        
          350
        
        
          Penetration rate (mm/s)
        
        
          u
        
        
          2
        
        
          (kPa)
        
        
          Fitting curve
        
        
          Mean values
        
        
          Figure 6. Correlation between the mean pore pressure and the mean
        
        
          penetration rate from 4.5 to 11.4 m below ground level. The standard
        
        
          rate of penetration of 20 mm/s has been marked with a dotted line.
        
        
          0.1
        
        
          1
        
        
          10
        
        
          100
        
        
          0
        
        
          2
        
        
          4
        
        
          6
        
        
          8
        
        
          10
        
        
          12
        
        
          Penetration rate (mm/s)
        
        
          q
        
        
          t
        
        
          (MPa)
        
        
          Fitting curve
        
        
          Mean values
        
        
          Figure 7. Correlation between the mean cone resistance and the mean
        
        
          penetration rate from 4.5 to 11.4 m below ground level. The standard
        
        
          rate of penetration of 20 mm/s has been marked with a dotted line.