600
Proceedings of the 18
th
International Conference on Soil Mechanics and Geotechnical Engineering, Paris 2013
2 INSITU TEST RESULTS
Although high-density sampling is required in order to evaluate
the spatial distribution of soil parameters, the amount of data is
not sufficient in the general sampling plans. In such cases,
sounding is a convenient way to identify the spatial distribution
structure of soil parameters. In this research, an embankment at
Site H is analyzed, for which SWS tests were conducted at 9
points, at 5-m intervals, along the embankment axis, as shown
in Figure 1. The soil profile of the embankment is categorized
as intermediate soil.
Generally, the strength parameters are assumed based on
standard penetration tests (SPT) with the use of empirical
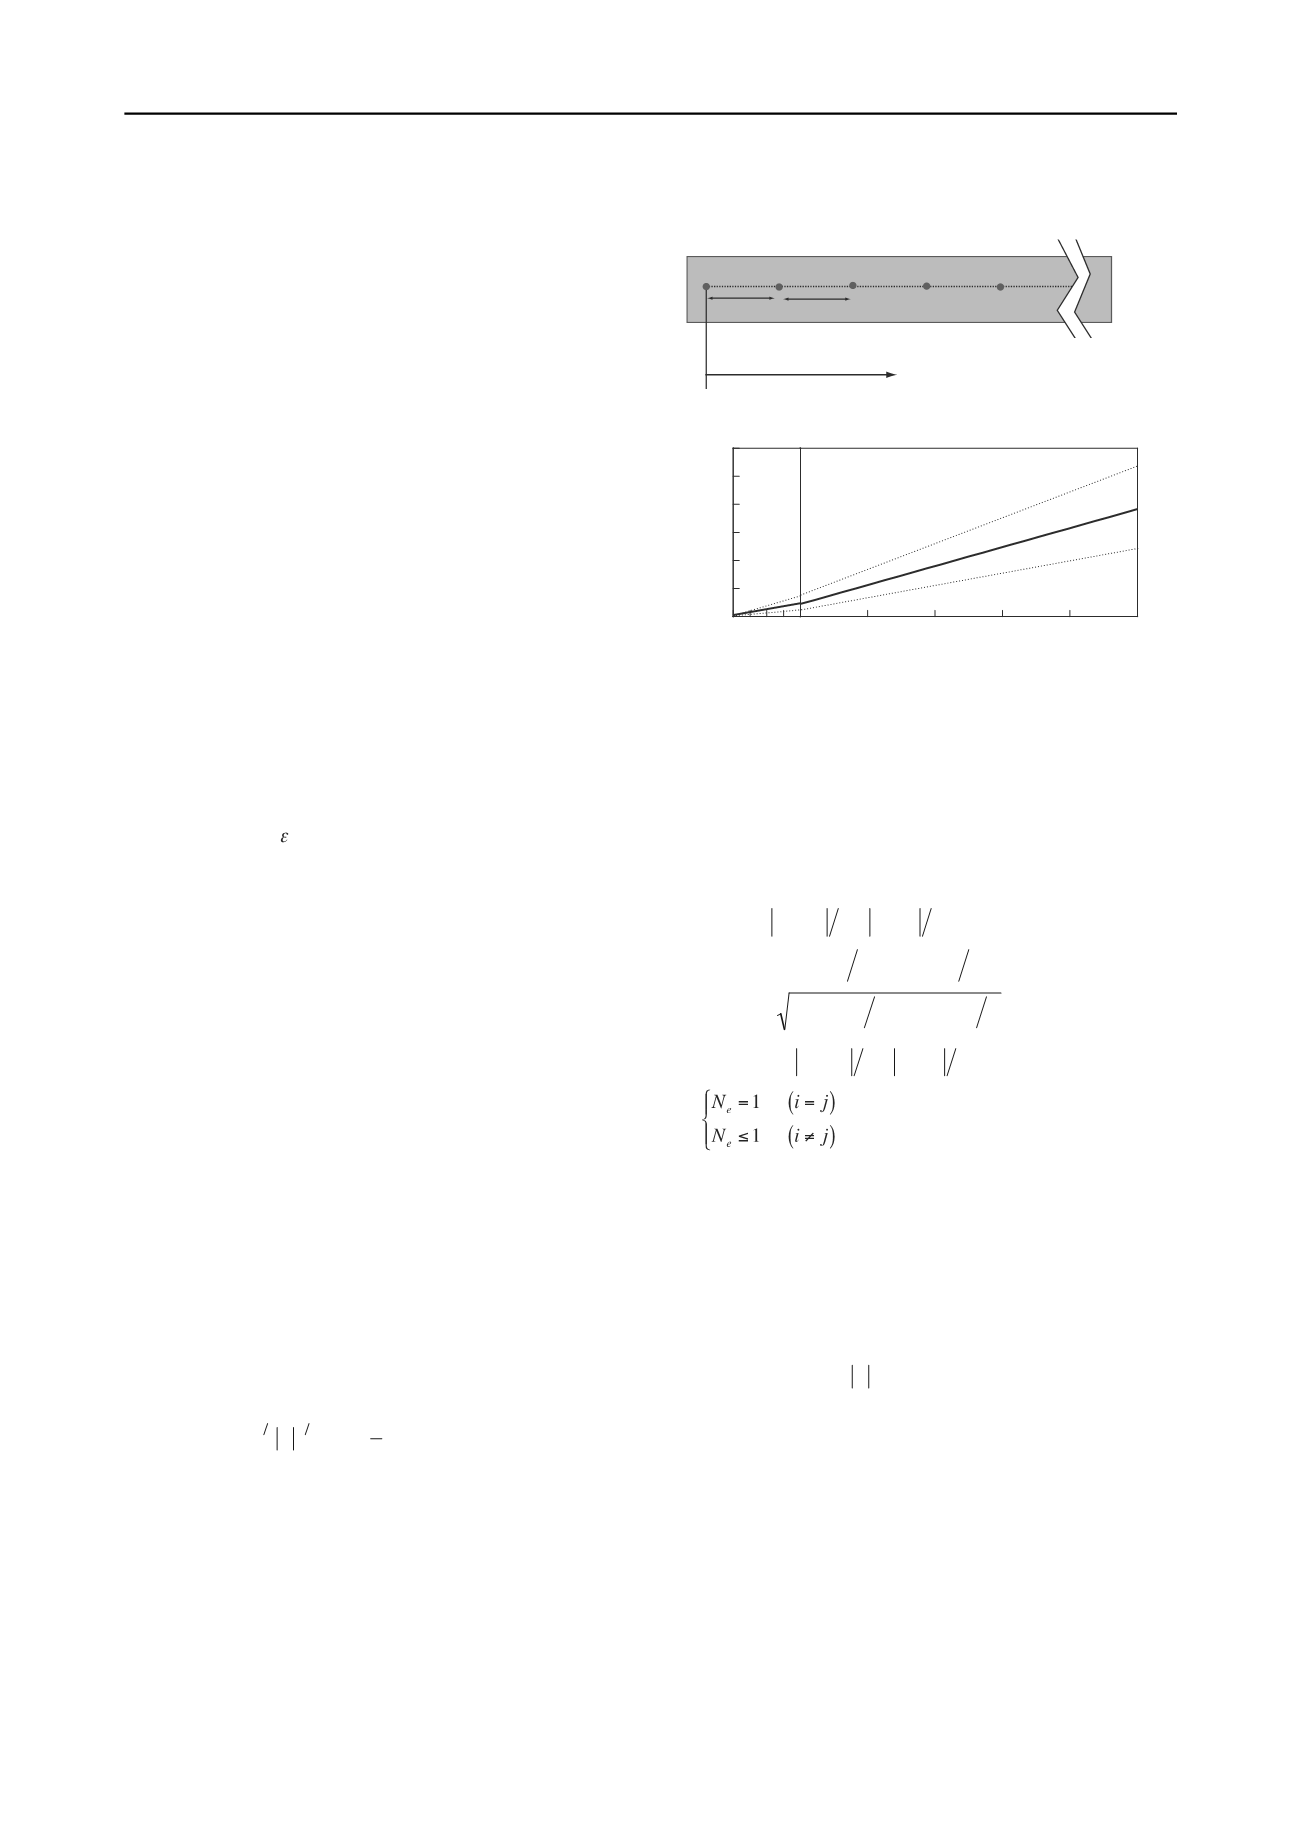
relationships. In this research, Swedish weight sounding tests,
which are simpler than SPT, are employed instead of SPT.
Inada (1960) derived the relationship between the results of SPT
and SWS. Equation (1) shows the relationship for sandy
grounds, and the relationship is shown in Figure 2.
N
SWS
0.67
N
SW
0.002
W
SW
(1)
in which NSWS is the N-value derived from SWS, NSW is the
number of half rations and WSW is the total weight of the
loads. Based on this data, the variability of the relationship is
evaluated in this study, and the coefficient of variation is
determined as 0.354. The determined σ-limits are also shown in
Figure 2 with broken lines. Considering the variability of the
relationship, the SPT N-values are derived by
5m
Plan view of test points
Top of embankment
x
No.1 No.2
No.3
No.4
No.5
Figure 1. Plan view of embankment and testing interval.
J
J
J
J
J
J
J
J
J
JJ
J
J
J
J
J
J
J
J
J
J
J
J
J
J
J
J
J
J
J
J
J
J
J
J
J
J
J
J
J
J
J
J
J
JJ
J
JJ
JJ
J
JJ
J
J
J
J
J
J
JJ
J
J
J
J
J
J
J
J
J
JJJ
J
J
JJ
J
50 100 150 200 250
N
sw
J
0
5
10
15
20
25
30
0
250
500
750
1000
N
W
sw
(N)
Figure 2. Relationship between SWS results and SPT N-values.
N
SPT
1
0.354
r
N
SWS
(2)
in which
r
is an
N
(0,1) random variable.
3 STATISTICAL MODEL OF
N
-VALUES
3.1
Determination method
A representative variable for the soil properties,
s
is defined by
Equation (3) equation as a function of the location
X
=(
x
,
y
,
z
).
Variable
s
is assumed to be expressed as the sum of the mean
value
m
and the random variable
U
, which is a
N
(0,1) type
normal random variable in this study.
s
X
m
X
U
X
(3)
The random variable function,
s
(
X
), is discretized spatially into
a random vector
s
=(
s
1
,s
2
,...,s
M
), in which
s
k
is a point estimation
value at the location
X
=(
x
k
, y
k
, z
k
). The soil parameters, which
are obtained from the tests, are defined here as
S
=(
S
1
,S
2
,..., S
M
).
Symbol
M
signifies the number of test points. Vector
S
is
considered as a realization of the random vector
s
=(
s
1
,s
2
,...,s
M
).
If the variables
s
1
, s
2
,...,s
M
constitute the
M
- variate normal
distribution, the probability density function of
can then be
given by the following equation.
f
S
s
2
M
2
C
1 2
exp
1
2
s
m
t
C
-
1
s
m
(4)
in which
m
=(
m
1
,m
2
,...,m
M
) is the mean vector of random
function
s
=(
s
1
,s
2
,...,s
M
) and is assumed to be the following
regression function. In this research, a 2-D statistical model is
considered, namely, the horizontal coordinate
x,
which is
parallel to the embankment axis, and the vertical coordinate
z
are introduced here, while the other horizontal coordinate
y,
which is perpendicular to the embankment axis, is disregarded.
k
a
0
a
1
x
k
a
2
z
k
a
3
x
k
2
a
4
z
k
2
a
5
x
k
z
k
(5)
in which (
x
k
, z
k
) means the coordinate corresponding to the
position of the parameter
s
k
, and
a
0
,
a
1
,
a
2
,
a
3
,
a
4
, and
a
5
are the
regression coefficients.
C
is the
M
×
M
covariance matrix, which is selected from the
following four types in this study.
C
C
ij
exp
x
i
x
j
2
l
x
z
i
z
j
l
z
(a)
2
exp
x
i
x
j
2
l
x
2
z
i
z
j
2
l
z
2
(b)
2
exp
x
i
x
j
2
l
x
2
z
i
z
j
2
l
z
2
(c)
N
e
2
exp
x
i
x
j
l
x
z
i
z
j
l
z
(d)
(6)
i
,
j
1,2,
,
M
in which the symbol [
C
ij
] signifies a
i-j
component of the
covariance matrix,
is the standard deviation, and
l
x
and
l
z
are
the correlation lengths for
x
and
z
directions, respectively.
Parameter
N
e
is the nugget effect. The Akaike’s Information
Criterion, AIC (Akaike 1974) is defined by Equation (7),
considering the logarithmic likelihood.
AIC
2
max ln
f
S
S
2
L
M
ln2
min ln
C
S
m
t
C
1
S
m
2
L
(7)
in which
L
is the number of unknown parameters included in
Equation (4). By minimizing AIC (MAIC), the regression
coefficients of the mean function, the number of regression
coefficients, the standard deviation,
, a type of the covariance
function, the nugget effect parameter, and the correlation
lengths are determined.
3.2
Determination of statistical model of SWS N-values
The mean function and the covariance function of the SWS
N
-
values,
N
SWS
, are determined with MAIC, and the mean and the
σ-limits are exhibited in Figure 3. Although the covariance
functions given by Equation (6) were examined, the available
correlation lengths were not identified. Therefore, additional
mean functions are examined. Since the periodic tendency,


