597
        
        
          Technical Committee 102 /


            Comité technique 102


            Proceedings of the 18


            th


            International Conference on Soil Mechanics and Geotechnical Engineering, Paris 2013


          0
        
        
          50
        
        
          100
        
        
          150
        
        
          200
        
        
          250
        
        
          0
        
        
          1000
        
        
          2000
        
        
          3000


            q


            T


            - σ


            vo


            (kPa)


          4000


            Su (kPa)


          pacted clays was found to be
        
        
          applicable, based on comparable UU and CPT test results
        
        
          n of modulus of vertical deformation was
        
        
          made for relevant results for oedometer and CPT test.
        
        
          Lunne et al (199
        
        
          ession for
        
        
          modulus of vertical deformation from CPT test when
        
        
          Figure 4. Nk=15 Nk = 15 for com


            2.3. Modulus of vertical deformation


          Compariso
        
        
          7) critically analyse expr
        
        
          determined as
        
        
          )
        
        
          (25,8
        
        
          0


            v


            T


            q


            M


          In this case it seems that this value should be de
        
        
          factor of two (Fig. 5). This might be due to the
        
        
          this gener
        
        
          (2
        
        
          vided y
        
        
          fact t
        
        
          al expression has limitations, and becou
        
        
          oedometer tests were performed on submerged specime
        
        
          while CPT and DMT tests were performed on clay fill
        
        
          the embankment that was not submerged. Values of Mv
        
        
          from DMT test were the highest of these three (Fig. 6)
        
        
          (Fig. 6).
        
        
          )
        
        
          b
        
        
          hat
        
        
          se
        
        
          ns
        
        
          in
        
        
          would be respected, then big
        
        
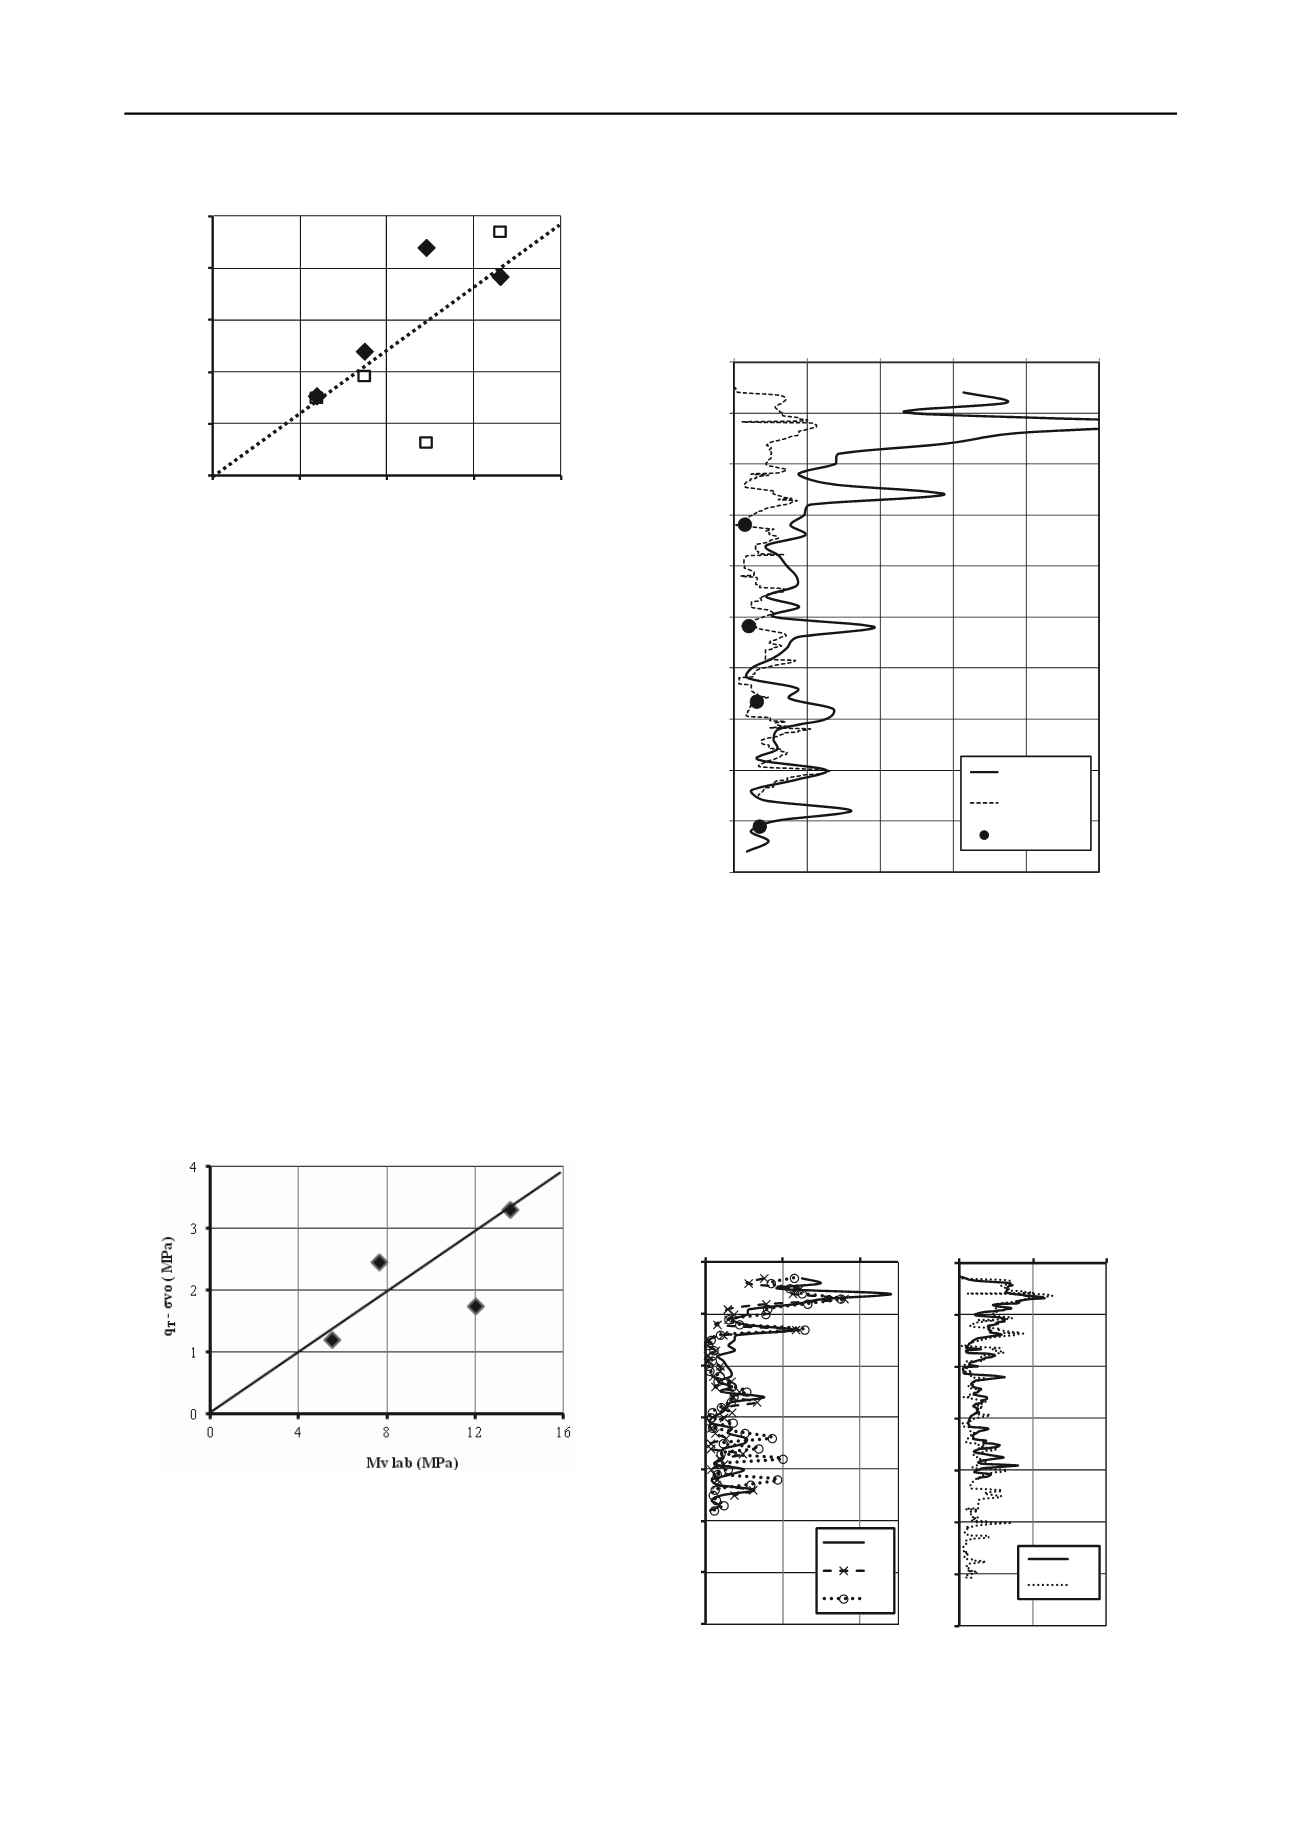
          Figure 5. Relationship between laboratory determined modulus
        
        
          of vertical deformation and corrected tip resistance for CPT test,
        
        
          around B5 borehole
        
        
          Based on a limited number of available test results, the
        
        
          expression Mv=4, 3 (q
        
        
          t
        
        
          -σ
        
        
          vo
        
        
          ) seems to better fit test results
        
        
          than the equation (2). Modulus seems to be half of the
        
        
          value suggested by that commonly used equation. If
        
        
          relationship between DMT-M
        
        
          v
        
        
          and LAB M
        
        
          v
        
        
          from Fig 6
        
        
          ger portion of the
        
        
          then required
        
        
          compared to situation illustrated in Fig 3 (M proj) .
        
        
          embankment would show lower values
        
        
          0
        
        
          1
        
        
          2
        
        
          3
        
        
          4
        
        
          5
        
        
          6
        
        
          7
        
        
          8
        
        
          0
        
        
          40
        
        
          80
        
        
          120
        
        
          160
        
        
          200
        
        
          Mv DMTM3
        
        
          Mv CPT C2
        
        
          9
        
        
          10
        
        
          Mv lab


            (m)


            Mv  (MPa)


          from oedometer (on
        
        
          r than from CPT
        
        
          if compared to DMT
        
        
          (performed on clay layers that
        
        
          were not submerged)
        
        
          Fig. 7 presents the sets of CPT and DMT tests with a
        
        
          view to illustrate soil resistance in relation to depth. It
        
        
          seems that the results of tests from different locations are
        
        
          very similar throughout the depth of testing.


            d


          Figure 6. Modulus of vertical deformation
        
        
          submerged specimens) was much smalle
        
        
          interpretation (equation (2)) or even lower
        
        
          standard interpretation values
        
        
          0
        
        
          2
        
        
          4
        
        
          6
        
        
          8
        
        
          10
        
        
          12
        
        
          14
        
        
          0
        
        
          100
        
        
          200
        
        
          M3
        
        
          M2
        
        
          M1


            Mv (MPa)


            d (m)


          0
        
        
          2
        
        
          4
        
        
          6
        
        
          8
        
        
          10
        
        
          12
        
        
          14
        
        
          0
        
        
          10
        
        
          2


            q


            c


            [MPa]


          0
        
        
          C1
        
        
          C2


            d (m)


          Figure 7. CPT and DMT tests in cumulative presentation