574
Proceedings of the 18
th
International Conference on Soil Mechanics and Geotechnical Engineering, Paris 2013
19
19 16
17 15
15
10 3
16 14
16
13
11
14 11 6
-3 -5 0
-4 -4
-1 1 3
=
Results
1
st
DEM Grid Map
2
nd
DEM Grid Map
-
No data Erosion Deposition
Variation of Volume
= Result x Unit grid area
Grid Subtraction
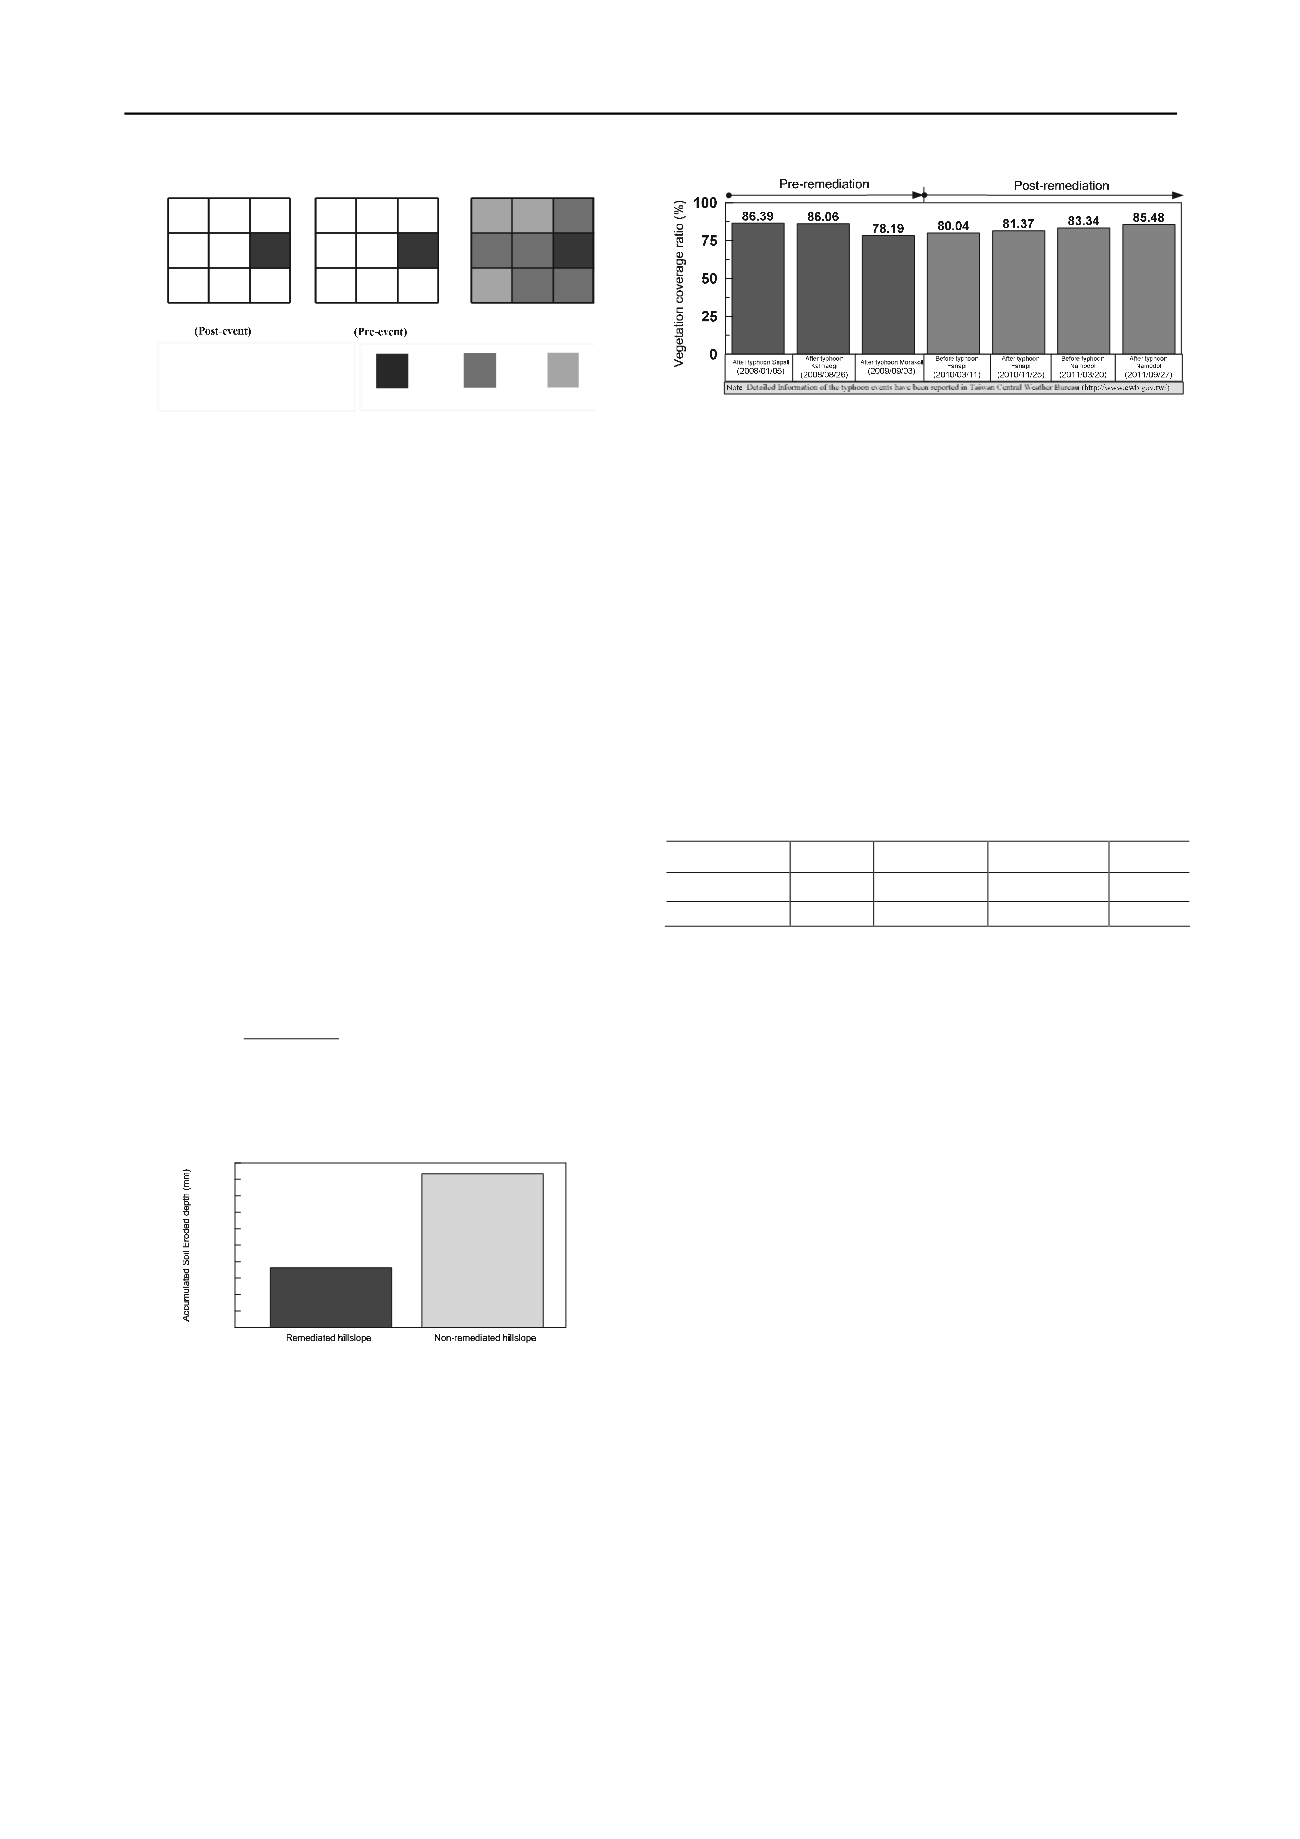
Figure 7. Grid subtraction in post-event and pre-event digital terrain
elevations
4 CASE STUDY
In this paper, case study chooses Longjiao creek located at
downstream area of Tsengwen Reservoir (see Figure 2) for
proving the effectiveness of remediation efforts after typhoon
Morakot, based on real data from multi-scale sediment
monitoring techniques. Then, the proposed depth-area-volume
based methods are all applied to evaluate the ratios of soil
erosion suppression, vegetation coverage and sediment trapping
in the following sections.
4.1 Soil erosion suppression
To effectively measure surface soil loss on remediated and non-
remediated hillslopes, ten erosion pins were installed on each of
the hillslopes types to monitor eroded soil depth for each
rainfall events. The monitoring period is from May 14., 2011 to
Oct. 04, 2011. Figure 8 is the diagram of the average
accumulated eroded soil depth on remediated and non-
remediated hillslopes. According to the figure, soil erosion of
remediated hillslopes is obviously lower than the remediated.
Compared with others, remediated hillslopes can reduce soil
erosion by about 1.6 mm. This data is input into Eq. (1) and
then the
SSR
of Longjiao subwatersehd is obtained as below
:
%23.61 %100
7.18
25.77.18
(%)
SSR
(5)
The calculated result shows that remediation of hillslops could
reduce erosion amounts by 61.23% of soil loss per unit area and
time. It is evident that remediation can accelerate environmental
vegetation recovery and under good practical sediment control.
7.25
18.7
0.00
4.00
8.00
12.00
16.00
20.00
Figure 8. Diagram of average accumualted eroded soil depth on
remediated and non-remediated hillslopes.
4.2 Vegetation coverage
Utilizing NDVI, multi-stage vegetation recovery of the overall
Longjiao subwatershed after remediation was assessed for the
five events. According to Eq. (2) and (3), the ratios of
vegetation coverage were calculated. Figure 9 shows that after
remediation, typhoon Fanapi and typhoon Namodol repeatedly
affected Longjiao subwatershed but the vegetation coverage
ratio (
VR
) still remained over 80%. This value was estimated by
satellite images and is better than the ratio after typhoon
Morakot. Again, these results show that remediation including
check dams, river bed foundation, and revetment as well as
excavation of deposited sediments, can effectively reduce
sediment yield.
Figure 9. Evolution of vegetation coverage in pre-remediation and post-
remediation for Longjiao subwatshed.
4.3 Sediment trapping
Soil and Water Conservation Bureau (2011) has collected three
high-precision digital elevation models from aerial orthoimages
and airborne LiDAR. These measurements can be divided into
pre-remediation and post-remediation. Further, sediment yield
is the total volume of terrain changes such as slope failures and
river erosions by grid subtraction of DTMS. Sediment trapping
ratio (STR) can be assessed by measuring the amount of
sediment trapped in front of the check dams, which has been
listed in Table 1. Compared with the results listed in table 1,
post-remediation STR of Longjiao subwatershed is significantly
higher than pre-remediation by 17.18 times. In the meantime,
the sediment yield after remediation is lower than before
remediation. Through the above results, it was found that
sediment yields were effectively controlled.
Table1 List of Sediment trapping ratio of Longjiao subwatershed
Stages
Duration
Sediment yield
(m
3
)
Sediment trapping
(m
3
)
STR (%)
pre-remediation
2008~2010
1,548,300
34,540
2.2
post-remediation
2010~2011
149,143
56,373
37.8
5 CONCLUSIONS
This study systematically integrates multi-scale sediment
monitoring techniques to analyze soil erosion, vegetation
coverage, and sediment trapping from easily measured physical
quantities such as depth, area, and volume in a watershed scale.
Thorough the case study, it suggests that remediation in
Tsengwen Reservoir Watershed are certainly effective and are
able to reduce sediment production and soil loss entering a
reservoir.
6 REFERENCES
Soil and Water Conservation Bureau (SWCB), 2010.
Multi-scale
environmental measurements and evaluation of conservation and
management efficiency for Tsengwen reservoir watershed
(in
Chinese).
Lo, W.-C., Lin, Bor-Shiun., Ho, H.-C., Keck Jeff k, Yin, H.-Y. and H.-
Y., Shan 2012.
“A
simple and feasible process for using multi-stage
high-precision DTMs, field surveys and rainfall data to study
debris-flow occurrence factors of S
henmu area, Taiwan”
,
Natural
Hazards and Earth System Sciences
, 12, 3407-3419.
Lin, Bor-Shiun, Cheng-Yang Hsiao,Wai-Yi Leung and Shu-Yeong Chi
2012.
“Using Airborne LiDAR Technology to Analyze Landslide
Hazards in Shih-
men Watershed”
,
European Geosciences Union,
General Assembly 2012
, 14, EGU2012-2884, Vienna, Austria,
22~27, April.
Schumm, S. 1956.
“Evolution of
Drainage Systems and Slopes in
B
adland at Perth Amboy”,
Bulletin of Geological Society of
America
, 67, 597-646.
Kriegler, F.J., Malila, W.A., Nalepka, R.F., and Richardson, W., 1969.
“Preprocessing
Transformations and Their Effects on Multispectral
R
ecognition”
,
Proceedings of the Sixth International Symposium on
Remote Sensing of Environment
, 97-131.
Sophie L., Tim W. E., Peter B. H., and David J. T. 2008.
“
Sediment
trapping by a tree belt: processes and consequences for sediment
delivery,
Hydrological Processes
, 22(17), 3523-3534.


