576
Proceedings of the 18
th
International Conference on Soil Mechanics and Geotechnical Engineering, Paris 2013
ground surface at different sites were measured and the
difference of elevation may be considered.
To quantify the differences between CPT and CPTU
measurements, the ratios of the CPTU to CPT cone resistance
and sleeve friction measurements were calculated for each site.
The reference line positioned at an average CPTU to CPT ratio
equal to one in the plots of average ratios represents the
theoretical value if soil variability was eliminated and if there
was no effect of cone size. In general, the ratios of cone
resistance and sleeve friction measurements fluctuate near one,
and the measured values increase with depth. For the soft clay
sites (Figure 1), the average fs ratio of the friction sleeve is
always significantly greater than the average qc ratio. For the
topsoil such as fill and silty clay, the ratios CPTU to CPT
fluctuate drastically. The relationships of derived key
parameters are developed between China CPT and international
CPTu (Table 1). From the perspective of engineering practice, it
is concluded that
q
t
= 1.03
q
c
,
f
s
-
CPTu
= 1.05
f
s
-
CPT
. The
empirical equation can be used as useful engineering tool to
guide use of 10 cm
2
international CPTu in China.
16
14
12
10
8
6
4
2
0
0
1
2
3
4
Depth/m
Coneresistance
Sleevefriction
AverageofCPTU/CPTratios
Figure 1. Statistical analysis of
q
c
and
f
s
ratios
Table 1. Conversion relationships between CPTu and CPT parameters.
Soil types
Regression equation
Cone resistance
Sleeve friction
Soft clay
q
t
= 1.04
q
c
f
s-CPTU
= 1.01
f
s
-CPT
Clay
q
t
= 1.02
q
c
f
s-CPTU
= 1.07
f
s
-CPT
Stiff clay
q
t
= 1.01
q
c
f
s-CPTU
= 1.06
f
s
-CPT
Silt
q
t
= 1.03
q
c
f
s-CPTU
= 1.06
f
s
-CPT
Silty sand
q
t
= 1.03
q
c
f
s-CPTU
= 1.03
f
s
-CPT
3 EVALUATION OF ENGINEERING
CHARACTERISTICS BASED ON CPTU TESTS IN CHINA
3.1 Stress history
Since the advent of CPTU in geotechnics, nearly 20 different
methods have been suggested for interpreting the
preconsolidation pressure and the overconsolidation ratio of
clays (Mayne 1991). In this study, the three sites with all
sensitive clay deposits in Jiangsu province of eastern China are
selected (Liu et al., 2007). These Quaternary clay deposits are
located at Lianyungang, Changzhou and Nanjing respectively.
Whenever possible, the OCR values interpreted from various in
situ tests were compared with the oedometer values for
Lianyungang marine clay. At the other test sites, in addition to
oedometer results, some field OCR values were deduced from
field performance observation of trial embankments. These field
values provide a reliable basis for evaluating the validity of the
various interpretation methods in Jiangsu clays. Table 2
presents a summary of the typical property values of the soil
layers.
Table 2. Typical property values of the soils.
Site
Soil type
Water
content/%
Liquid
limit
Plasticity
index
Lianyungang
muck
79.6
75.6
35.8
Changzhou
clay
23.5
41.8
19.0
Nanjing
mucky
silty clay
41.4
36.4
13.3
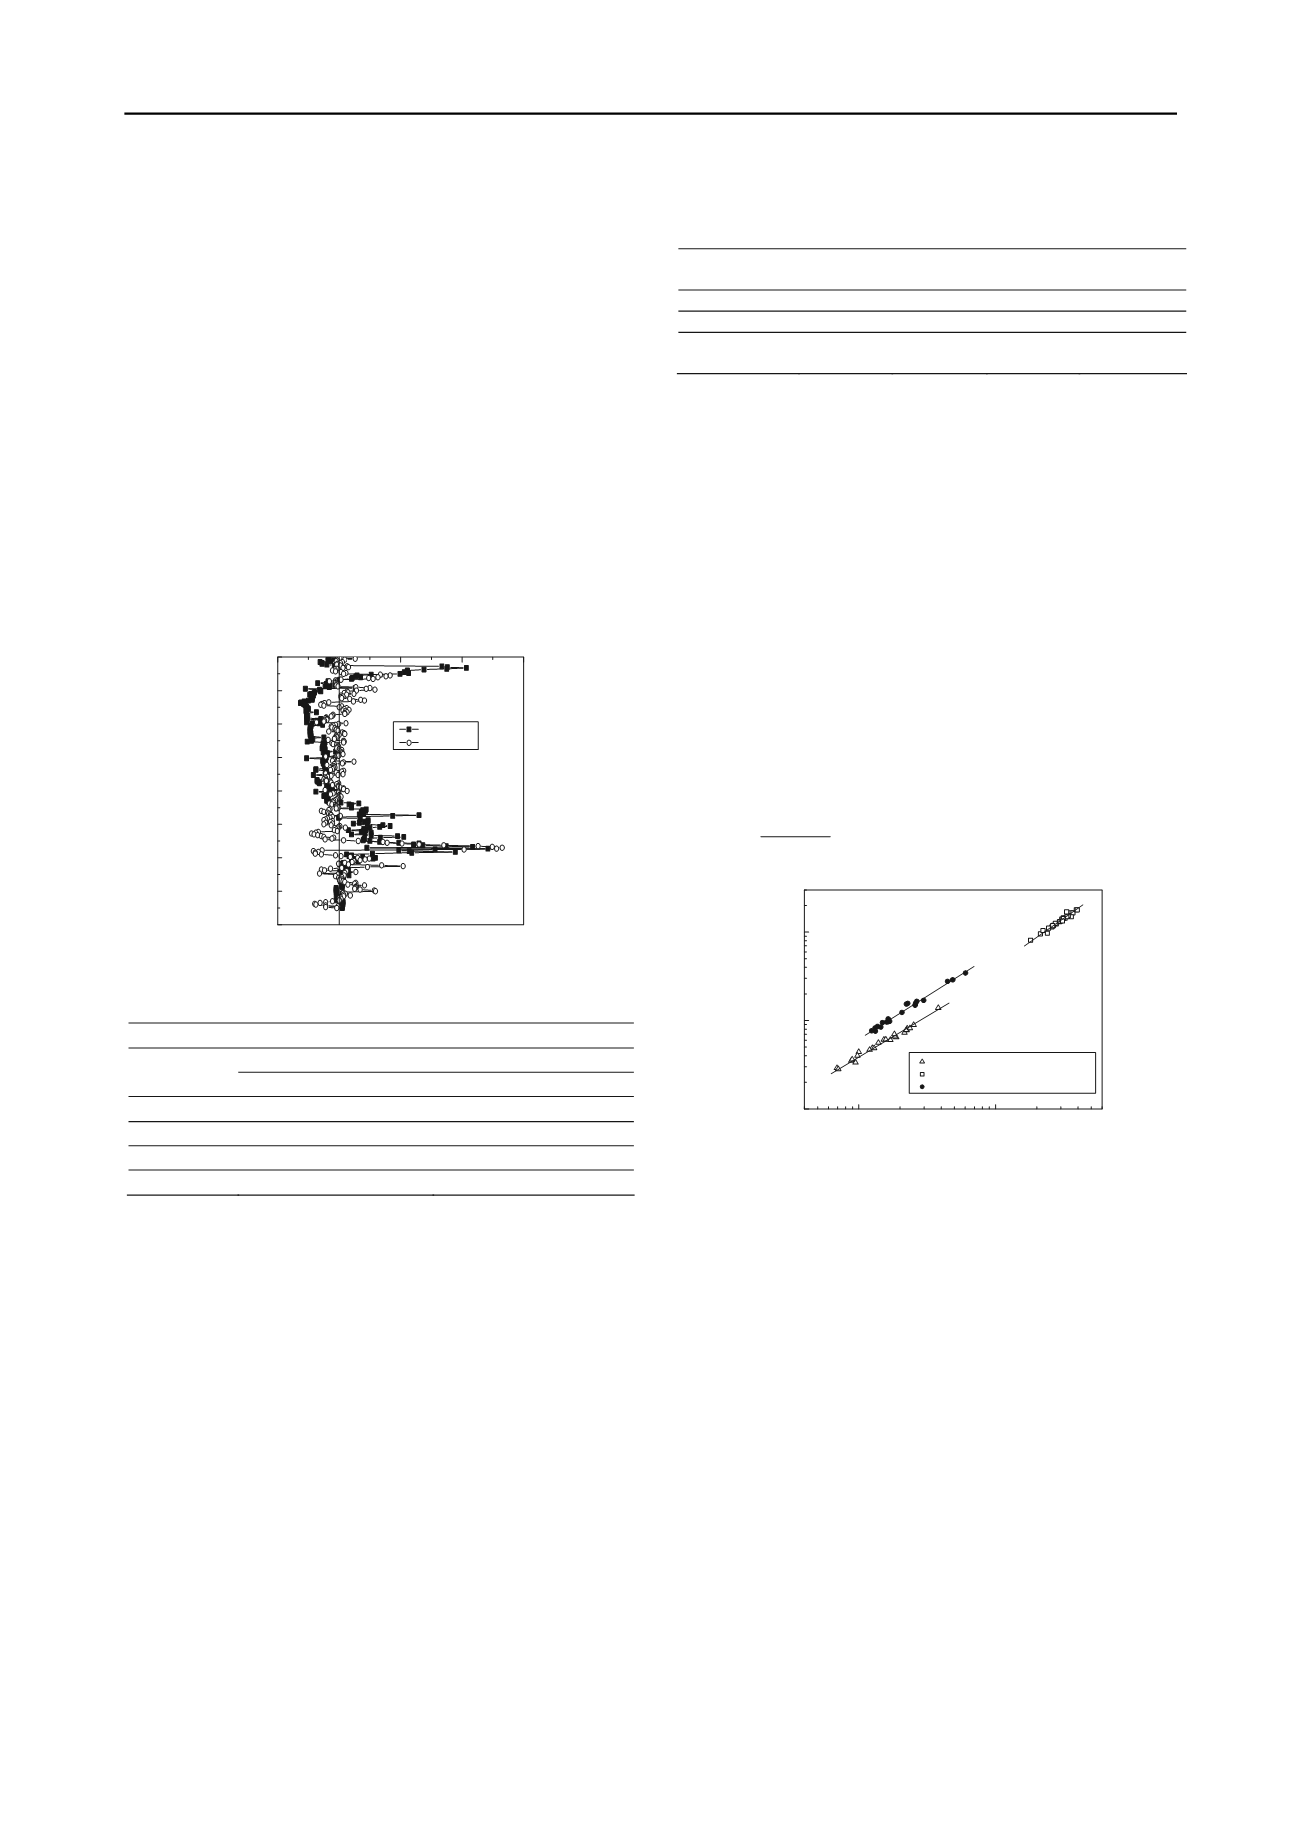
Figure 2 shows the relationship between net tip resistance
(
q
t
–
σ
vo
) and the preconsolidation pressure (
σ
`
p
) measured in the
laboratory oedometer test on high-quality samples. Here, n as
shown in Fig. 1 is the number of data available. In Lianyungang
marine clay deposits, the correlation is excellent (
r
2
= 0.99) for
all the data, and the preconsolidation pressure varies between 29
and 139 kPa. In Changzhou clay site, the correlation is good (
r
2
= 0.95) for the data, and the preconsolidation pressure varies
between 812 and 1789 kPa. It can be seen from Figure 5 that the
relationship between net tip resistance and the preconsolidation
pressure of Nanjing clay site is also pretty good (
r
2
= 0.98).
Consequently, we can obtain the value of Nσt factor, which is
equal to 2.7 according to the correlation relationship for
Lianyungang lightly overconsolidated clay. Similarly, for
Changzhou lightly to moderately overconsolidated clay, the
N
σt
factor is 2.2. For Nanjing backswamp clay deposit, the
N
σt
factor is 2.5. Consequently, the equation defining the correlation
of Lianyungang marine clay site can be expressed as follows:
7.2
0
'
v
t
p
σ q σ
(1)
100
1000
10
100
1000
'
p-oed
/ kPa
( q
t
-
v0
) / kPa
Li anyungang( n=24, r
2
=0. 99)
Changzhou( n=28, r
2
=0. 95)
Nanj i ng( n=20, r
2
=0. 98)
Figure 2. The relationship between preconsolidation pressure measured
in oedometer test and net tip resistance
3.2 Deformation modulus
The one-dimensional constrained modulus, M, as measured in
an oedometer test, has been expressed in terms of a coefficient,
αm, and cone resistance:
cm
q M
(2)
where
α
m
is a correlation factor. In practice, it has been
usual to correlate the modulus
M
to a penetration resistance. To
estimate one-dimensional constrained modulus
M
, the
correlation with net cone resistance (
q
t
-
σ
v0
) is used in the form
(Kulhawy and Mayne, 1990):
8.25
8.25
n
t
M q
q
vo
(3)
Comparisons between M from CPTU with laboratory
oedometric modulus for various types of soil proposed by
Kulhawy and Mayne (1990) showed that the ratio M -
CPTU
/ M -
lab
could equal to 2.21 for high-plasticity clays and silty soils. In
Figure 3 the constrained modulus estimated with relationship
(3) is plotted against that determined by laboratory oedometric
tests, carried out on all the types of Jiangsu lagoonal soils. In
our case, the ratio M-
CPTU
/M-
lab
is always greater than the unity
and is not influenced by the type of soil or by its cone resistance
value (Cai et al. 2010).


