561
Technical Committee 102 /
Comité technique 102
having enough thickness. On the other hand, very low
permeable capability is assumed for Ds6 and 7 that have been
evaluated to have insufficient thickness with high degree of fine
contents and poorly continuous. The other layers have been
evaluated as the ordinary permeable capability. The used all soil
parameters for analysis are also exactly the same with that used
by Mimura and Jeon (2011).
5 RESULTS AND DISCUSSIONS
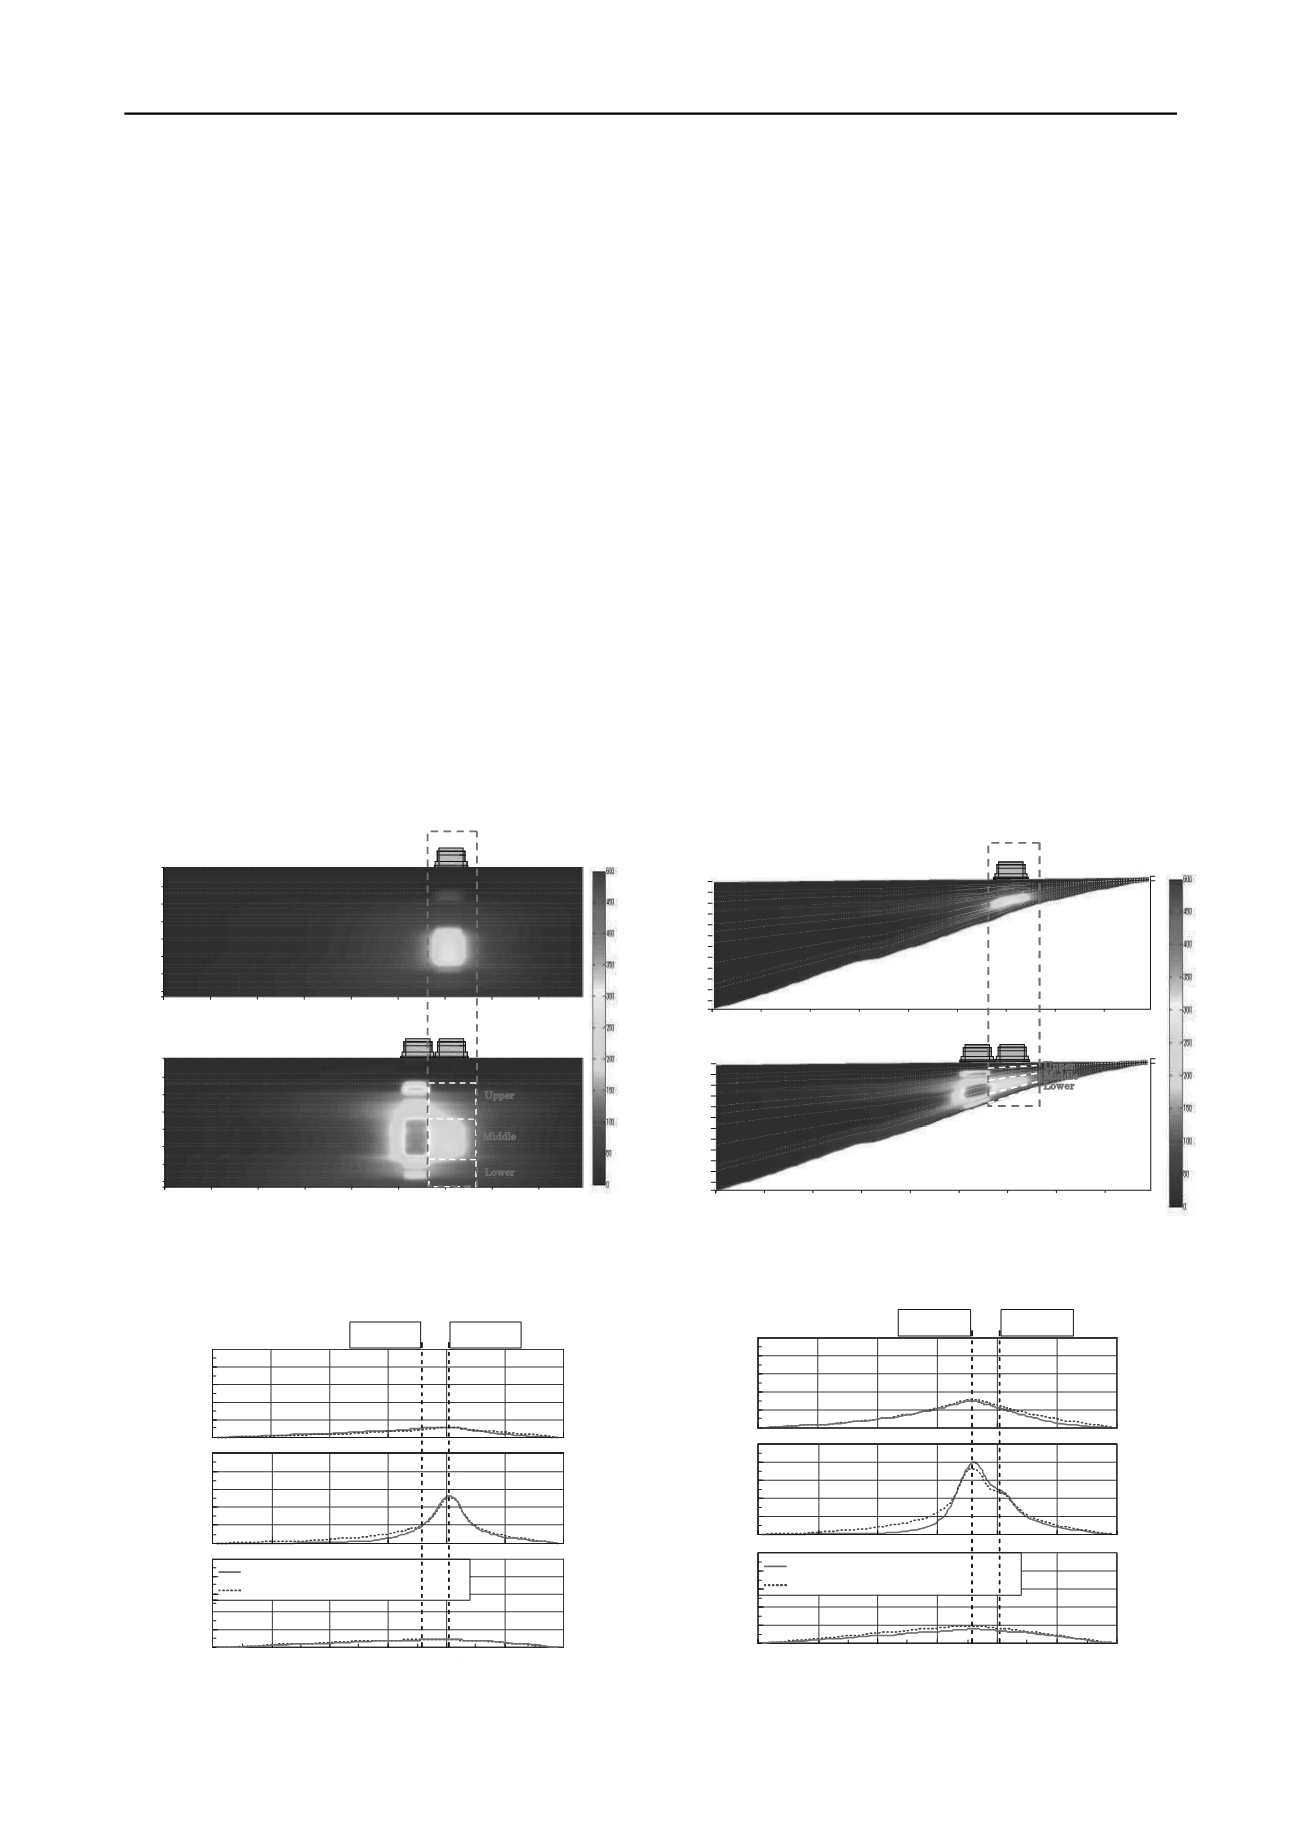
The calculated distribution of excess pore water pressure before
and after the construction of the 2
nd
phase island is shown in
Fig.4 for two foundation models respectively. As shown in
Fig.4, the similar distribution tendency of excess pore water
pressure can be seen for two foundation models. It should be
noted that a large amount of excess pore water pressure still
remains undissipated in the middle Pleistocene clay layers,
Ma10, 9 and Doc5&Ma8 as well as sand gravel layers, Ds6 and
7 before the construction of the 2
nd
phase island because of poor
permeability of sand gravel layers, Ds6 and 7. In contrast, the
excess pore water pressure in the upper and lower Pleistocene
layers such as Dtc, Ma12,11,7,6 and Ds1,3,9,10 is
monotonically dissipated with time because of high
permeability of sand gravel layer, Ds1,3 and 10. At the
completion of the 2
nd
reclamation, a large amount of excess
pore water pressure is concentrated in the upper and middle
Pleistocene layers such as Ma12, 10, 9 and Doc5&Ma8 beneath
the foundation of the 2
nd
phase island. Here, a due attention
should also be paid to the fact that the increased excess pore
water pressure beneath the foundation of the 2
nd
phase island is
propagated to that of the 1
st
phase island. Since the permeability
of the upper and lower Pleistocene sand gravel layers is higher
than the one of the middle layers, a larger amount of excess
pore water pressure in the upper and lower Pleistocene layers is
propagated compared to the one in the middle layers of the
foundation of the 1
st
phase island.
The calculated horizontal distribution of excess pore water
pressure in the representative Pleistocene sand gravel layers
(Ds3, 6, 10) are shown in Fig. 5 at the time before and after the
construction of the 2
nd
phase reclamation for both foundation
models. In the present study, the identical permeable capability
for the individual Pleistocene sand gravel layers in two
foundation models is applied by considering the concepts of
“
mass permeability
”
and
“
standard hydraulic gradient
”
.
However, in Fig.5, it should be noted that the distribution of
excess pore water pressure near the 1
st
phase island almost
shows a good match for two foundation modes by applying the
concept
“
standard hydraulic gradient
”
whereas the one of the
other region shows the discrepancy distribution with the stress
level. The stress level beneath the foundation of the 1
st
phase
island is almost the same for two foundation models because the
representative model was developed based on the monitoring
point 1 whereas the one beneath the foundation of the 2
nd
phase
island is different each other due to change in thickness of
geologically genuine foundation model. It is noteworthy that
1 phase
2 phase
nd
st
0
2000
4000
6000
8000
10000
12000
14000
16000
17880
Distance(m)
-160
-18
-40
-80
-100
-120
-140
-60
Elevation(m)
-166
Ma13
Ds1
Dtc
Ma12
Ds2
Ds3
Ma11U
Ma11L
Ds4
Ds5
Ds6
Ds7
Ds8
Ds9
Ds10
Ma10
Ma9
Doc5&Ma8
Ma7
Ma6
Completion of 2
nd
phase reclamation
(after 19years from construction)
1 phase
st
-160
-18
-40
-80
-100
-120
-140
-60
Elevation(m)
-166
0
2000
4000
6000
8000
10000
12000
14000
16000
17880
Distance(m)
Ma13
Ds1
Dtc
Ma12
Ds2
Ds3
Ma11U
Ma11L
Ds4
Ds5
Ds6
Ds7
Ds8
Ds9
Ds10
Ma10
Ma9
Doc5&Ma8
Ma7
Ma6
Before construction of 2
nd
phase reclamation
(after 13years from construction)
(Unit: kPa)
Upper
Middle
Lower
Figure 4(a). Contour of excess pore water pressure for representative
foundation model at before and completion of 2
nd
phase reclamation
0
2000
4000
6000
8000
10000
12000
14000
16000
17880
Distance(m)
-30
-619
-80
-130
-180
-230
-280
-330
-380
-430
-480
-530
-580
Elevation(m)
-6
-26
Ma13
Ds1
Dtc
Ma12
Ds2
Ds3
Ma11U
Ma11L
Ds4
Ds5
Ds6
Ds7
Ds8
Ds9
Ds10
Ma10
Ma9
Doc5&Ma8
Ma7
Ma6
1 phase
st
2 phase
nd
0
2000
4000
6000
8000
10000
12000
14000
16000
17880
Distance(m)
-30
-619
-80
-130
-180
-230
-280
-330
-380
-430
-480
-530
-580
Elevation(m)
1 phase
st
-6
-26
Ma13
Ds1
Dtc
Ma12
Ds2
Ds3
Ma11U
Ma11L
Ds4
Ds5
Ds6
Ds7
Ds8
Ds9
Ds10
Ma10
Ma9
Doc5&Ma8
Ma7
Ma6
Upper
Middle
Lower
Before construction of 2
nd
phase reclamation
(after 13years from construction)
Completion of 2
nd
phase reclamation
(after 19years from construction)
(Unit: kPa)
Figure 4 (b). Contour of excess pore water pressure for geologically
genuine foundation model at before and completion of 2
nd
phase
reclamation
500
400
300
200
100
0 0
3000
6000
9000
12000 15000 18000
Ds10
P.W.P
Horizontal distance (m)
500
400
300
200
100
0
Ds6
P.W.P
500
400
300
200
100
0
Ds3
P.W.P
Center of 1
phase island
st
Center of 2
phase island
nd
Representative foundation
Geologically genuine foundation
Excess pore water pressure(kPa)
500
400
300
200
100
0 0
3000
6000
9000
12000 15000 18000
Horizontal distance (m)
500
400
300
200
100
Center of 1
phase island
st
Center of 2
phase island
nd
Excess pore water pressure(kPa)
Ds3
Ds10
P.W.P
Representative foundation
Geologically genuine foundation
500
400
300
200
100
0
P.W.P
0
Ds6
P.W.P
(a) Before the 2
nd
phase reclamation
(b) Completion the 2
nd
phase reclamation
Figure 5. Horizontal distribution of excess pore water pressure for the representative Pleistocene sand gravel layers (Ds3, 6, 10) in a horizontal position


