40
Proceedings of the 18
th
International Conference on Soil Mechanics and Geotechnical Engineering, Paris 2013
Proceedings of the 18
th
International Conference on Soil Mechanics and Geotechnical Engineering, Paris 2013
The pile’s overall capacity was well predicted, as were pile head
movements up to half Q
T
. The approach gave broadly successful
numerical predictions for all piles’ initial stiffness responses
under compression and cyclic loading as well as insights into the
shaft shear stress distributions, the strain fields and potential
group interaction effects: see Jardine and Potts 1988.
Lateral/moment loading responses and group analyses may be
considered through 3-D approaches (Potts and Zdravkovic
2001). Stiffness anisotropy can be addressed within the same
non-linear framework: Addenbrooke et al 1997. However, the
time-independent FE analysis could not predict the large creep
movements that developed in the field, following a stick-slip
pattern, as failure approached. New research was required into
several aspects of behaviour:
The time dependent processes of ageing and creep.
The stress regime set up in the soil mass by driving.
How cycling affects stiffness, capacity and permanent
displacements.
4 INVESTIGATING TIME-DEPENDENT BEHAVIOUR
We consider below laboratory research designed to
investigate the time-dependent behaviour of piles driven in sand.
However, we note first that Bishop also recognised the need to
consider time effects carefully. Late in his career, he designed
elegant triaxial cells that used long, soft, adjustable mechanical
springs to provide uninterruptable and easily controlled long-
term deviator force actuators. Davies 1975 reports long-term
tests on natural clays conducted with several of the cells
described by Bishop 1981. We also note Tatsuoka’s 2011 very
thorough exploration of time-dependency in his Bishop Lecture.
Sand properties are often considered independent of rate and
time. However, long-term field observations reveal that
settlements can double or more under shallow foundations on
sand through long-term creep; Burland and Burbridge 1984,
Frank 1994 or Jardine et al 2005a. Kuwano and Jardine 2002a
reviewed the stringent experimental requirements necessary for
investigating the creep of sands through triaxial tests: very stable
high-resolution, local strain sensors are required, as are high
quality pressure and temperature control systems. Membrane
penetration has to be considered carefully; lubricated low-
friction sample ends are also recommended.
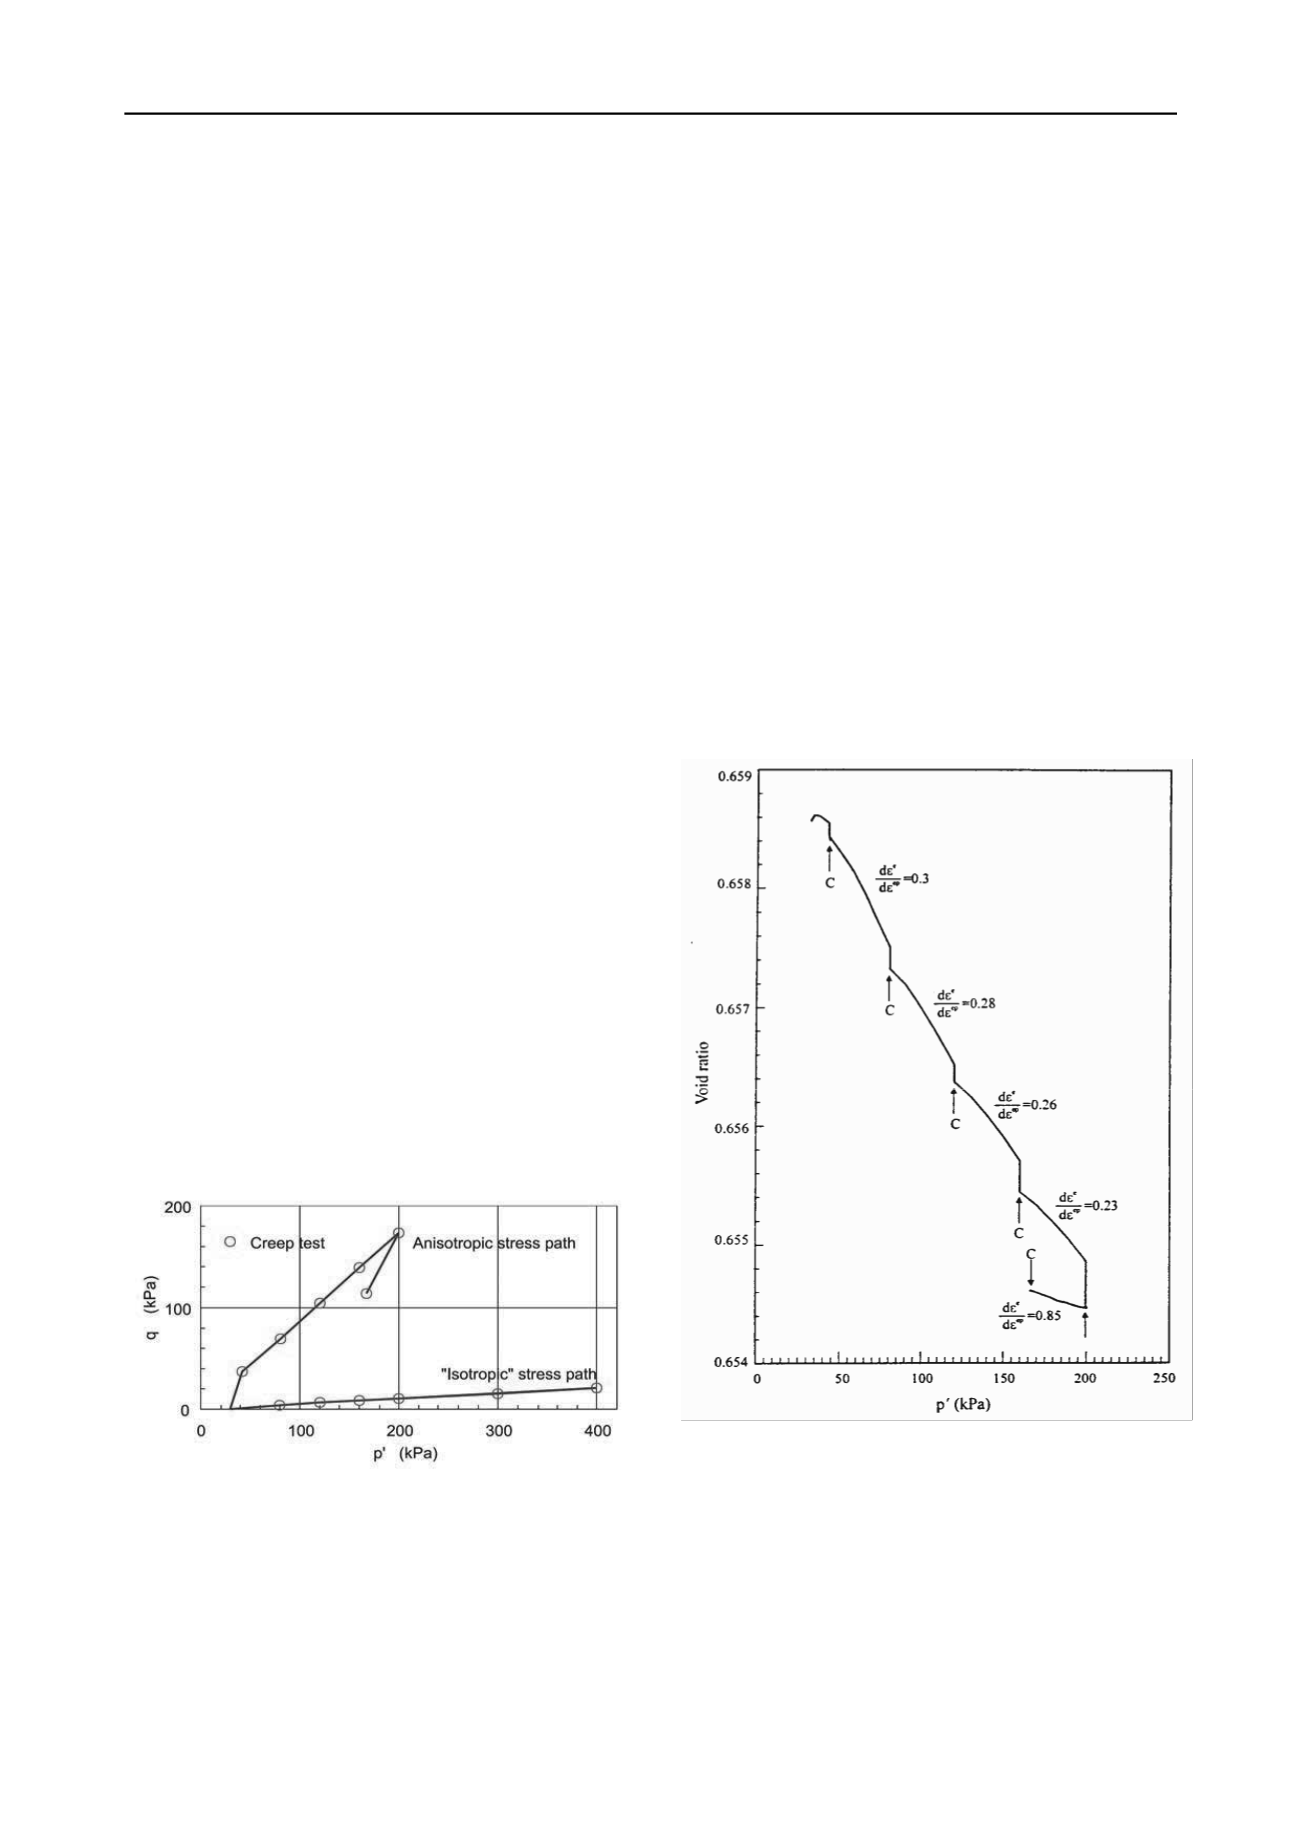
Fig. 11. Effective stress paths followed in drained ‘Creep’ stress path
tests on HRS and GB specimens: Kuwano and Jardine 2002a
Kuwano and Jardine illustrated aspects of short-term creep
behaviour through tests on saturated Ham River Sand (HRS) and
Glass Ballotini (GB) specimens prepared at various initial
densities. The tests advanced along the drained ‘near isotropic’
and ‘K
0
’ stress paths set out in Fig. 11 at mean stress rates dp΄/dt
of around 100 kPa per hour. The paths were punctuated, as
indicated, by periods ‘C’ where samples were allowed to creep
under constant stresses for several hours.
Pressure-dependent elastic stiffness functions (Equations 1 to
5) established from parallel tests were integrated to calculate the
contribution of elastic straining dε
e
to the overall total (elastic-
plastic) strains dε
ep
developed over each test stage. Figure 12
illustrates the void-ratio (e) - p΄ relationships obtained from the
K
0
normally consolidated stage of test H4 on an HRS specimen
prepared to the average relative density applying to the
Dunkerque field profile. The average dε
e
/dε
ep
ratios applying
during loading (dp΄/dt > 0) stages fall from 0.30 to 0.23 as
loading continues, indicating an increasingly plastic response.
However, the additional plastic strains developed during creep
stages (where dp΄/dt = dε
e
/dε
ep
= 0) become progressively more
significant as loading continued and contributed the major part
of the overall ‘consolidation’ strains (ε
con
) by the end of the test.
The latter point is emphasised in Fig. 13 by plotting the
proportion of the overall consolidation strain ε
con
that was due to
creep ε
cre
during the pause periods of test H4 and two otherwise
identical experiments on loose HRS and medium-dense, nearly
spherical, GB. Overall, the relative contribution of creep appears
to (i) grow with stress level and grain angularity and (ii) fall with
initial void ratio, OCR and stress ratio K = σ΄
3
/σ΄
1
. Jardine and
Kuwano 2002a also show that creep strain rates decay inversely
with time over the first few hours. Jardine et al 2001b offer
observations on the micro-mechanical processes that control the
experimental behaviour seen in triaxial and HCA tests.
Fig. 12. Overall e-p΄ relationship of K
0
compression tests on medium-
dense HRS, showing ratios dε
e
/dε
ep
of elastic to plastic strains and time-
dependent compression over creep stages (C): Jardine et al 2001b.
It is argued later that the kinematic conditions applying close
to the shafts of displacement piles impose approximately
constant volume conditions. The constant volume creep response
is illustrated in Fig. 14 by showing first the effective stress path
followed by an isotropically normally consolidated medium-
dense HRS specimen that was allowed to creep to a stable
condition before being sheared undrained in triaxial compression


