48
Proceedings of the 18
th
International Conference on Soil Mechanics and Geotechnical Engineering, Paris 2013
Proceedings of the 18
th
International Conference on Soil Mechanics and Geotechnical Engineering, Paris 2013
offering relatively low φ΄ beneath and around the tip, to being
dilatant, brittle and able to mobilise far higher peak φ΄ in the
mass that surrounds the shaft. These features were critical to
Jardine et al 2013b’s interpretation of the model pile Calibration
Chamber stress measurements illustrated above in Figures 24 to
27. Further analysis of the evolving family of ‘critical state’ e-p΄
curves developed by crushing is underway by Dr Altuhafi.
0
10
20
30
40
Strain%
0
10
20
30
40
50
', Degrees
P-T1
P-T2
P-T3
P-EE1
P-EE2
P-EE3
Ultimate
'
=30
o
0
5
10
15
20
25
Strain%
0
10
20
30
40
50
'
, Degrees
P-T1
P-T2
P-T3
Ultimate
'= 33
o
Peak
'= 42
o
Fig. 37. Mobilised φ΄ values plotted against axial strain for both high (a)
and low (b) pressure test stages of triaxial tests on NE34 sand: Altuhafi
and Jardine 2011
7 COMPARISON WITH NUMERICAL ANALYSES
Recently published numerical analyses allow further links to be
established between the soil element and model pile
experiments. Zhang et al 2013 present FE analyses of
penetration in sands in which they adopted an Arbitrary
Lagrangian Eulerian (ALE) approach to deal with the implicit
moving boundary problem and a constitutive model that
accounted for grain size distribution evolving through grain
breakage. Their analyses included simulations of the Calibration
Chamber (CC) model pile tests that applied a ‘breakage’
constitutive model that they calibrated against NE 34 laboratory
tests reported by Yang et al 2010 and others.
Zhang et al’s predictions for the Mini-ICPs end-bearing
characteristics were presented in Fig. 24, together with the CC
measurements. The agreement is good when considering the
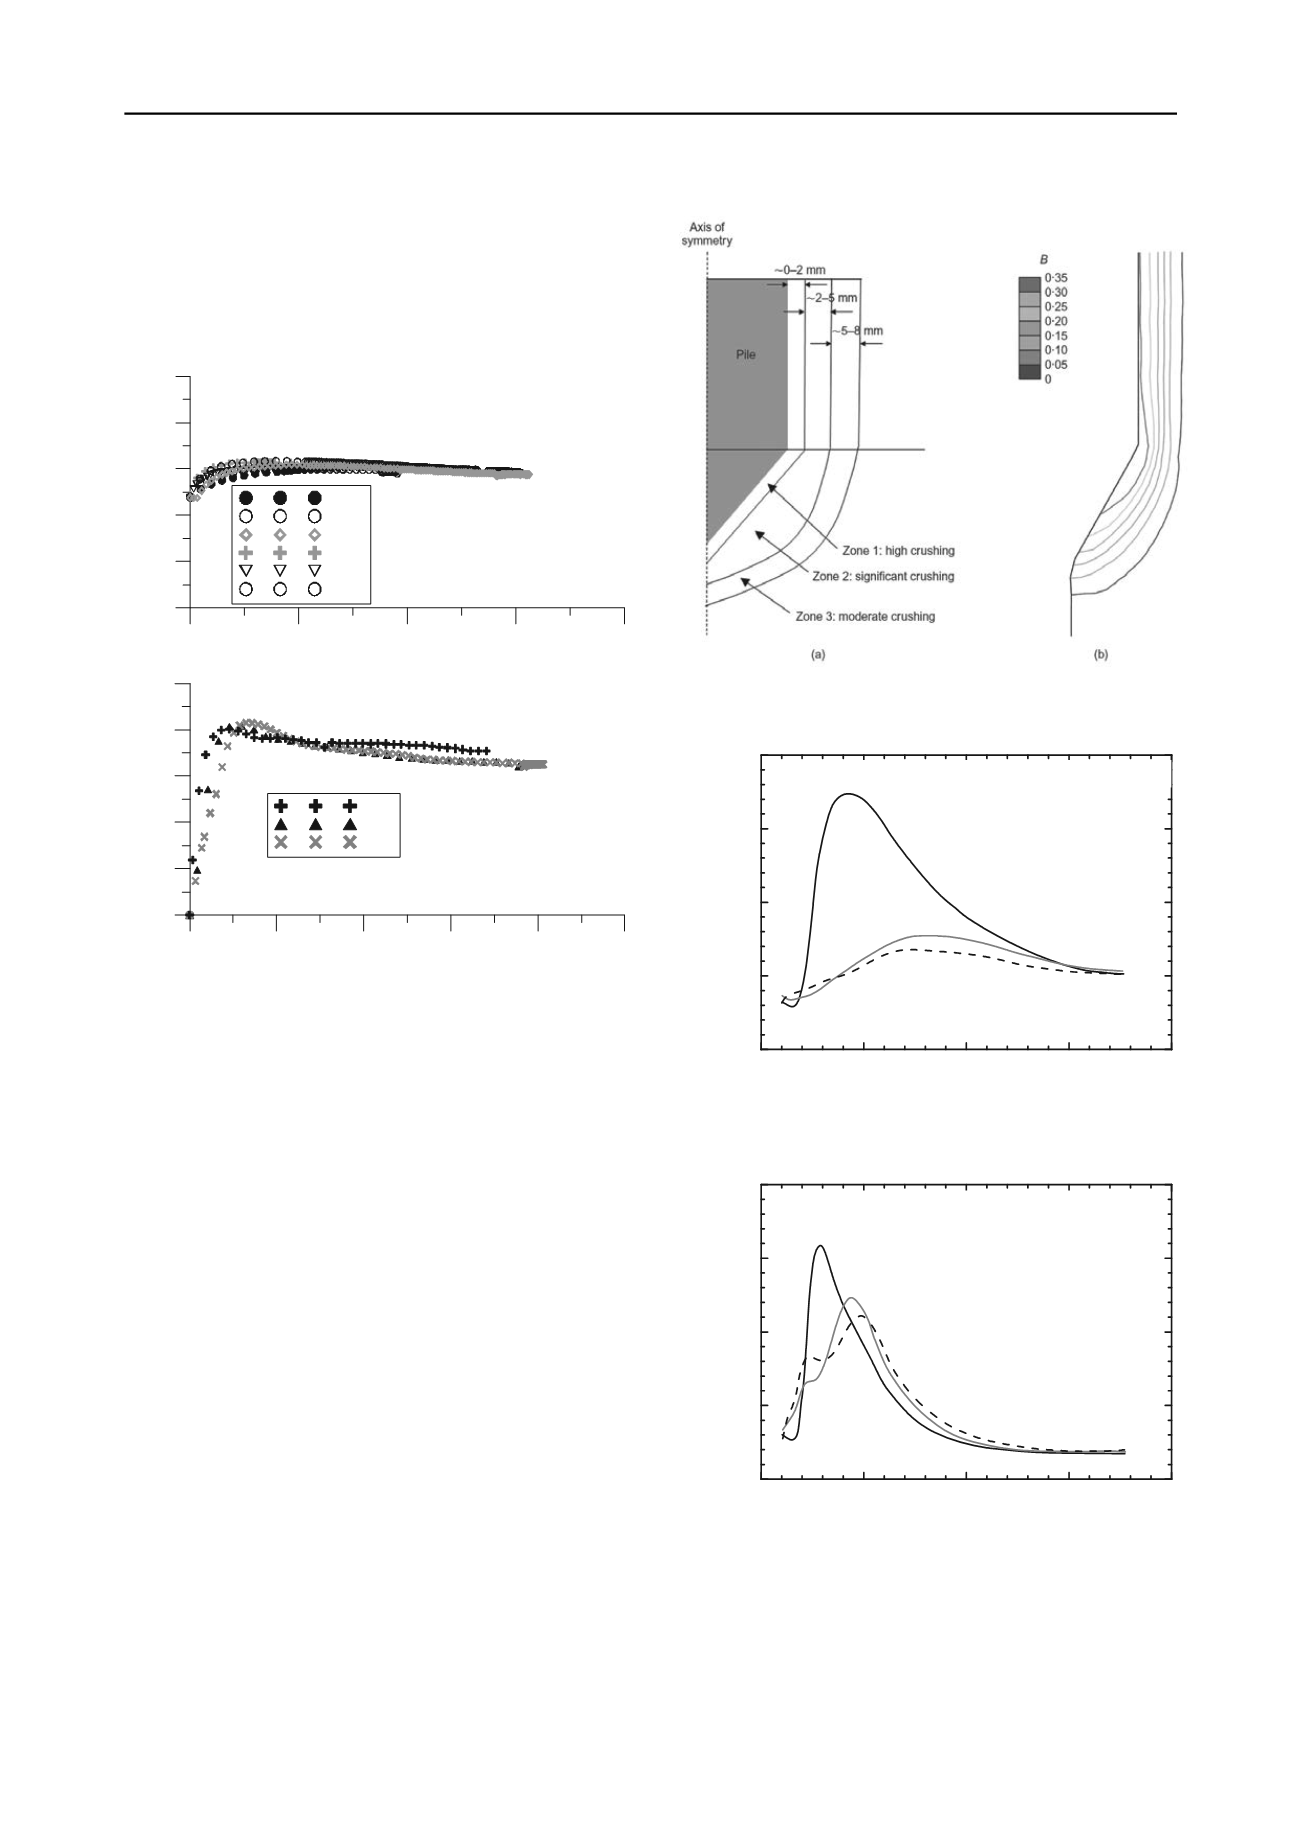
same CC upper boundary conditions. Figure 38 compares the
breakage pattern identified by Yang et al 2010 around the Mini-
ICP pile tip with Zhang et al 2013’s contoured predictions for
their internal breakage parameter B, which scales linearly
between the sand’s initial (B = 0) and ultimate (B = 1.0) ‘fully
crushed’ grading curves. The simulated and experimentally
established patterns are similar, with the maximum B predicted
as ≈ 0.35 close to the shaft, far from the ‘fully broken’ B = 1
limit. The grading curves’ predictions match Yang et al’s
measurements well in all three zones, although they do not
recover the experimentally observed Zone 1 thickness growth
with pile tip depth h/R. The latter is thought to develop through
the un-modelled process of cyclic interface shear abrasion.
Fig. 38. Comparison between (a) Yang et al’s interpretation of breakage
around penetrating Mini-ICP model piles and (b) simulation breakage
parameter B contours for same tests; Zhang et al 2013
0
5
10
15
20
0.0
1.5
3.0
4.5
6.0
h/R=3
h/R=6
'
r
/
q
c
: %
r
/
R
h/R=9
(a) Numerical results by Zhang et al. (2013)
Fontainebleau sand
Fig. 39. Radial profiles of σ΄
r
/q
c
from Zhang et al 2013’s analysis of
Mini-ICP pile in NE 34 sand
0
5
10
15
0.0
1.5
3.0
4.5
6.0
20
(a) Numerical results by Einav (2012)
h/R=3
h/R=6
'
/
q
c
: %
r
/
R
h/R=9
Fontainebleau sand
Fig. 40. Radial profiles of σ΄
θ
/q
c
from Zhang et al 2013’s analysis of
Mini-ICP pile in NE 34 sand.
Correspondence with Zhang, Nguyen and Einav led to
further processing of the stress predictions implicit in their
numerical analyses. Interesting comparisons are presented from
Yang et al 2013 in Figs. 39 and 40, plotting the σ΄
r
and σ΄
θ
predictions transmitted by Professor Einav against r/R. The
stresses are normalised by predicted q
c
, as are the experimental
equivalents shown in Figs. 26 and 27. The overall trends show


