45
Honour Lectures /
Conférences honorifiques
Proceedings of the 18
th
International Conference on Soil Mechanics and Geotechnical Engineering, Paris 2013
potential to explain the marked field capacity-time trends
illustrated in Fig. 1 by the Dunkerque tension pile loading tests.
6 LABORATORY TESTING AND FABRIC STUDIES TO
INVESTIGATE PARTICLE CRUSHING AND
INTERFACE SHEAR PROCESSES
The Calibration Chamber model pile tests also revealed the
important micro-mechanical features illustrated schematically in
Fig. 28. Post-mortem sampling revealed a clearly differentiated
grey coloured interface shear band (Zone 1) around the shaft, as
shown in Fig. 29. The following paragraphs report the insights
provided by laboratory studies into the breakage phenomena.
Their influence on the stress regime developed around the
penetrating pile is considered later.
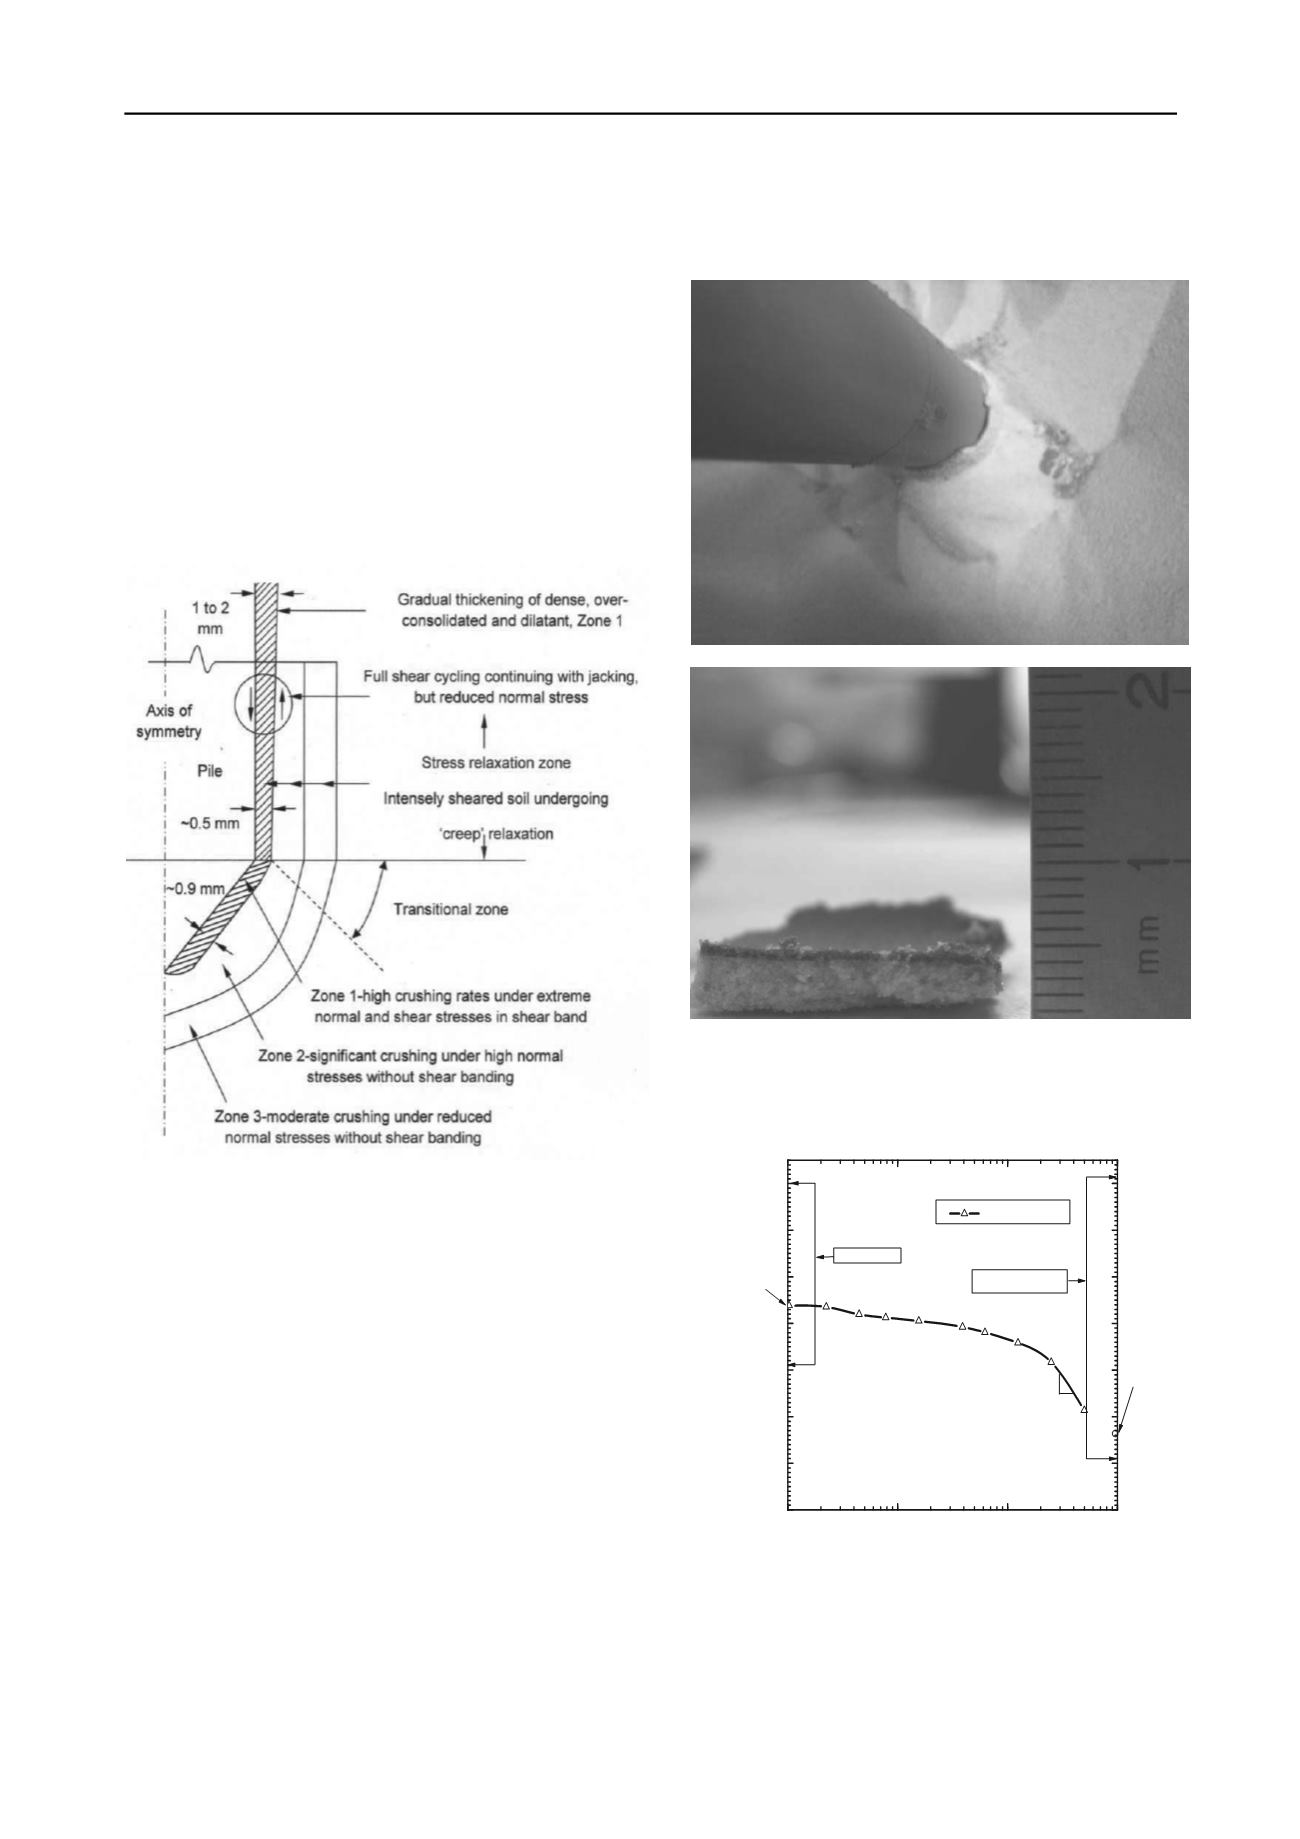
Fig. 28. Schematic of crushing and interface shearing zones developed
around laboratory model piles: Yang et al 2010
Yang et al 2010 describe how the three concentric micro-
fabric zones were defined, their diameters measured and samples
comprising only a few grams analysed with a QicPic laser-based
imaging system. The latter can resolve particles with sizes
between a few μm and several mm. Care is needed to relate the
various optical definitions of grain size with sieve analyses and
the Feret Minimum optical measurement correlated best. The
grey Zone 1 band contained the highest fraction of modified,
partially crushed sand. Fracture commenced beneath the active
pile tip area once q
c
> 5 MPa. The high pressure oedometer test
on NE 34 sand illustrated in Fig. 30 indicates that large scale
breakage is delayed until σ΄
z
> 10 MPa under K
0
conditions.
Yang et al tested material taken from the Zone 1 shear zone,
finding that breakage reduced the minimum void ratio e
min
very
considerably but had less effect on e
max
. The sand was densified
in the shear zone and manifested a higher relative density in
relation to its modified limits. The original (intact) and modified
(partially crushed) e
min
and e
max
values are shown on Fig 30 for
reference. Although not demonstrated here, the experiments
reported by Altuhafi and Jardine 2011 support the view that a
family of critical state lines evolve as breakage progresses under
high pressure shearing that are also strain-rate dependent. Stable
unique critical states do not appear feasible under such
conditions; Muir-Wood 2008 and Bandini and Coop 2011.
Fig. 29. Photographs of interface shear zone developed around
laboratory model pile: (a) top view from above and (b) side view of
shear zone material: Yang et al 2010
0.1
1
10
100
0.2
0.3
0.4
0.5
0.6
0.7
0.8
0.9
Zone1material
e
max
e
min
average Zone 1
unloaded
e
final
=
0.36
e
min
void ratio e
'
v
(MPa)
Loading curve
e
max
Fresh sand
c
c
=0.34
Initial state
e
o
Fig. 30. Void ratio-vertical effective stress relationship from high
pressure oedometer test on NE 34 sand, also showing e
min
and e
max
values
of intact sand (left) and Zone 1 material (right): Yang et al 2010
Once produced, the crushed material is smeared over the
advancing pile shaft giving an initial Zone I thickness ≈ 0.5mm,
which grew to ≈ 1.5mm at any given soil depth as the tip


