36
Proceedings of the 18
th
International Conference on Soil Mechanics and Geotechnical Engineering, Paris 2013
Proceedings of the 18
th
International Conference on Soil Mechanics and Geotechnical Engineering, Paris 2013
until creep rates slowed to pre-set limits; the piles took between
several hours and 1.5 days to reach failure. More rapid ML
tension tests that achieved failure with an hour were also
conducted after cyclic loading experiments. Testing rate was
found to affect displacements but have little influence on shaft
capacity. The cyclic tests were controlled to deliver
approximately sine-wave load variations at ≈ 1 cycle/minute.
The static testing investigated, among other factors, the
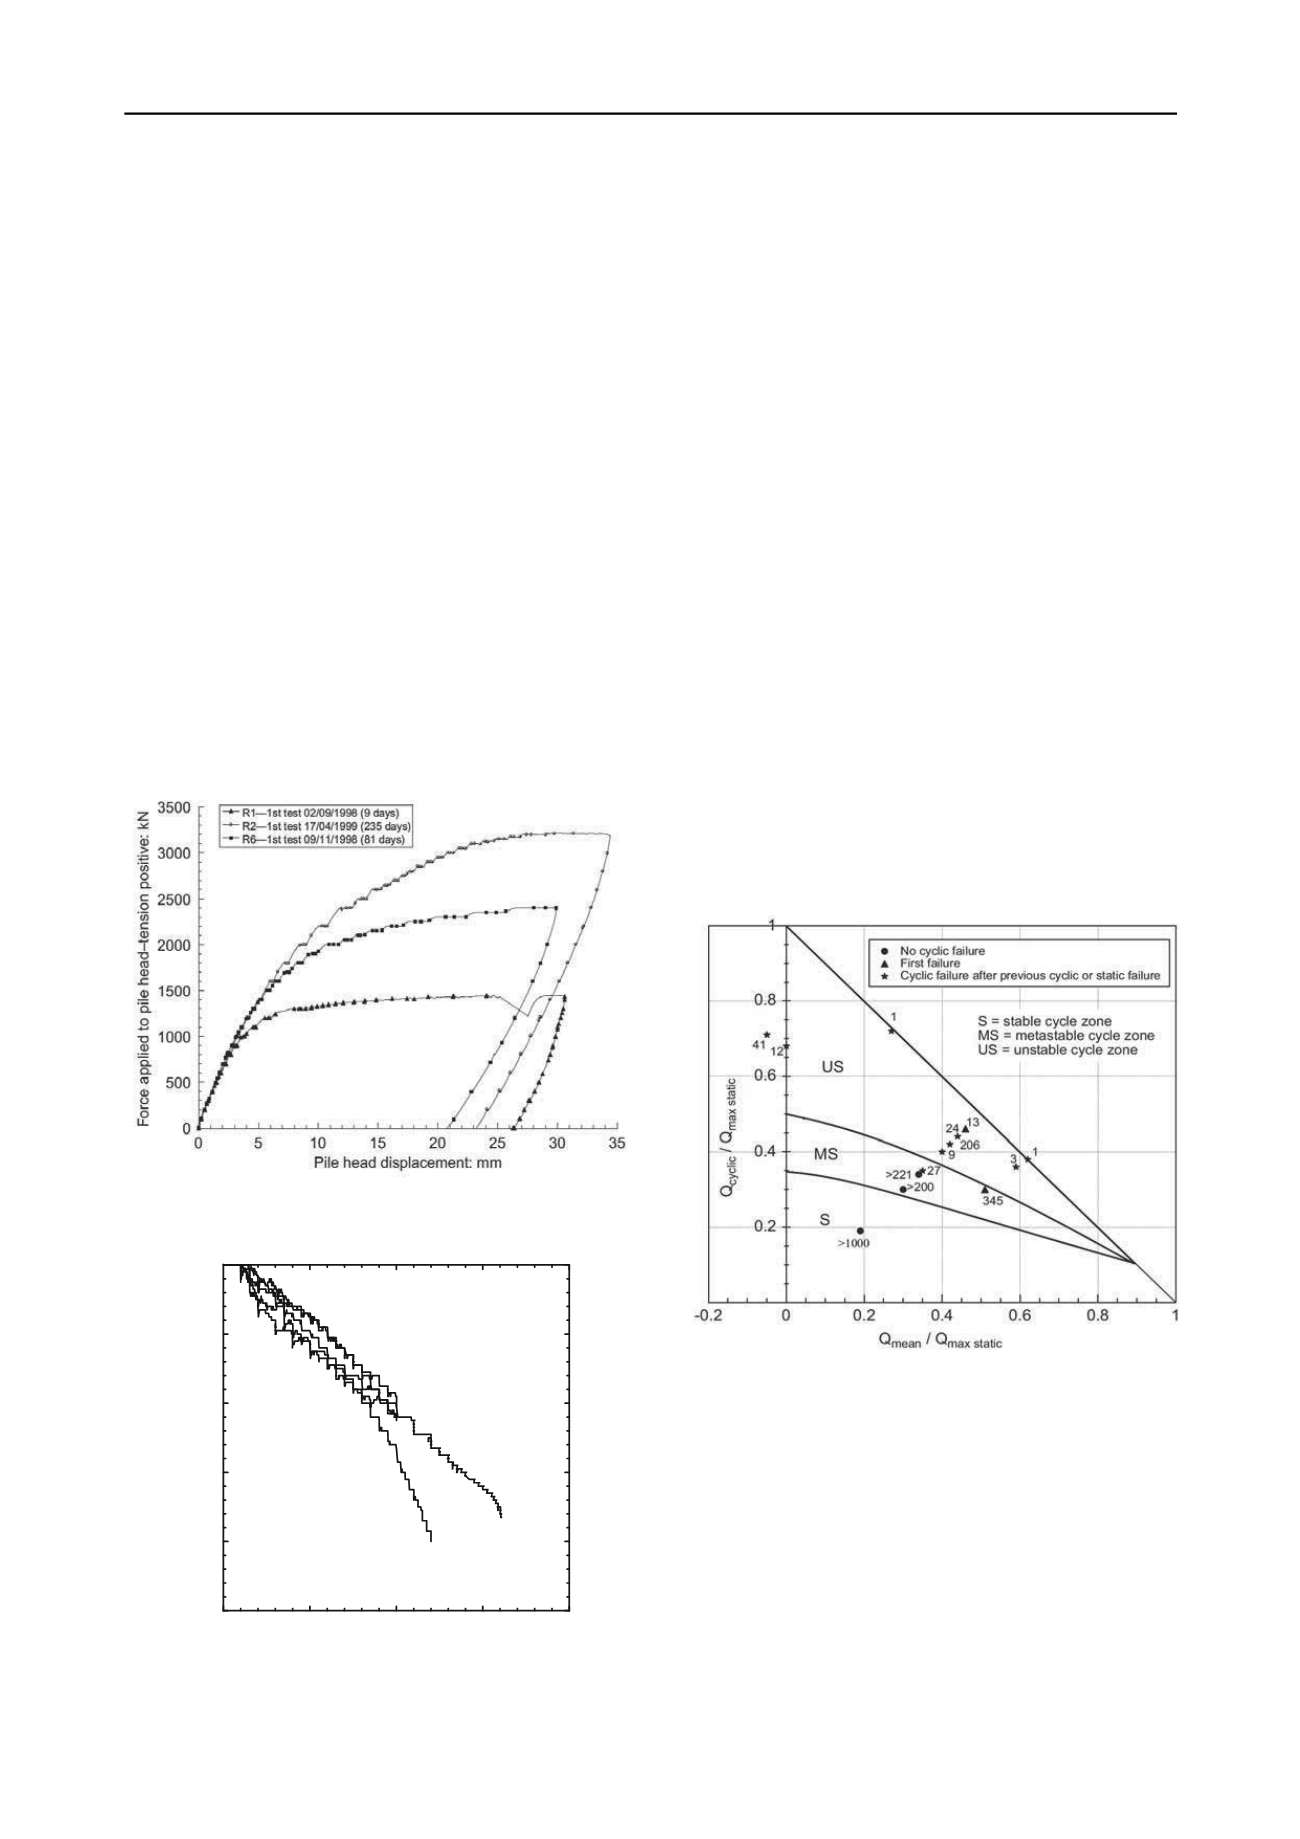
effects of pile age after driving. Figure 1 presents tension tests
on three identical piles that were aged for 9 to 235 days before
being failed for the first time. We note:
The load displacement (Q – δ) curves are practically
identical up to Q ≈ 1 MN but then diverge to show marked
increases in Q
ult
(the ultimate load shaft capacity) with age.
Creep displacements (dδ/dt when dQ/dt = 0) were negligible
until Q > 1 MN after which creep became progressively
more important, finally dominating as failure approached.
Load-displacement behaviour was highly non-linear. The
overall pile head secant stiffnesses k = Q/δ all fell as loading
continued with no discernible ‘linear-elastic’ plateau. This
feature is highlighted in Fig. 2 with data from ‘1
st
time’ tension
tests on five ‘R’ piles. The pile stiffnesses, k
l
, are normalised by
k
Ref
, the value developed under Q
Ref
- the first (200 kN) load
step. The loads Q are normalised by Q
Ref
.
Fig. 1. Load-displacement curves from first-time tension failures on
Dunkerque piles R1, R2 and R6: Jardine et al 2006
0
5
10
15
20
0.0
0.2
0.4
0.6
0.8
1.0
k
l
/k
Ref
Q/Q
Ref
R2 - R6
Fig. 2. Stiffness load-factor curves from 1
st
time tests at Dunkerque
conducted (except R6) around 80 days after driving: Rimoy et al 2013
An objective assessment was made of how well the
Dunkerque pile tests could be predicted by well-qualified
engineers by inviting entries to an open competition that
concentrated on the static and cyclic tests conducted ≈ 80 days
after driving; Jardine et al 2001a. Over 30 (many prominent)
international practitioners and academics took part, sending in a
wide spread of predictions. The axial capacity estimates
confirmed the expected CoV of 0.6, as well as significant bias;
the stiffness predictions were similarly spread.
No competitor was prepared to predict the cyclic test
outcomes; some indicated that cycling should have no effect in
clean sand. Figure 3 illustrates the field outcomes in a cyclic
failure interaction diagram. The conditions under which 13 tests
ended in failure and one developed a fully stable response are
summarised by plotting the normalised cyclic load amplitude
Q
cyc
/Q
max static
against the average mid-cycle load Q
mean
/Q
max static
where Q
max static
= Q
T
current tension capacity. If cycling and
testing rate had no effect, then failures should lie on the ‘top-left
to bottom-right’ diagonal static capacity line: Q
cyc
+ Q
mean
= Q
T
in Fig. 3. However, the cyclic test failure points all fell well
below this limit, proving a negative impact that grew directly
with Q
cyc
/Q
mean
. High-level two-way (tension and compression)
cycling could halve shaft capacity within a few tens of cycles.
Rimoy et al 2013 discuss the piles’ permanent displacement
and cyclic stiffness trends, noting also that their non-linear cyclic
stiffnesses depended primarily on Q
cyc
/Q
T
and did not vary
greatly with the number of cycles (N) until failure approached.
The permanent displacement trends were more complex,
depending also on Q
mean
/Q
T
and N. Interactions were seen
between the piles’ ageing and cyclic behaviours: low-level
cycling accelerated capacity growth while high-level cycling
slowed or reversed the beneficial capacity trend.
Fig. 3. Axial cyclic interaction diagram for full–scale cyclic tests on piles
driven at Dunkerque: Jardine & Standing 2012
We consider below eight research themes that addressed the
shortfalls in understanding revealed by the Dunkerque tests:
1. Characterising the sands’ true stress-strain relationships,
correlating advanced laboratory and in-situ measurements.
2. Checking, through Finite Element (FE) modelling, whether
laboratory-based non-linear predictive approaches led to
better matches with full scale behaviour.
3. Stress-path laboratory testing programmes that investigated
creep and ageing trends.
4. Studying the stress conditions imposed by pile installation
through highly instrumented Calibration Chamber tests.
5. Grain-crushing and interface-shear zone studies involving
high pressure triaxial, ring-shear and laser particle analysis.
6. Quantitative checking against advanced numerical analyses.


