39
Honour Lectures /
Conférences honorifiques
Proceedings of the 18
th
International Conference on Soil Mechanics and Geotechnical Engineering, Paris 2013
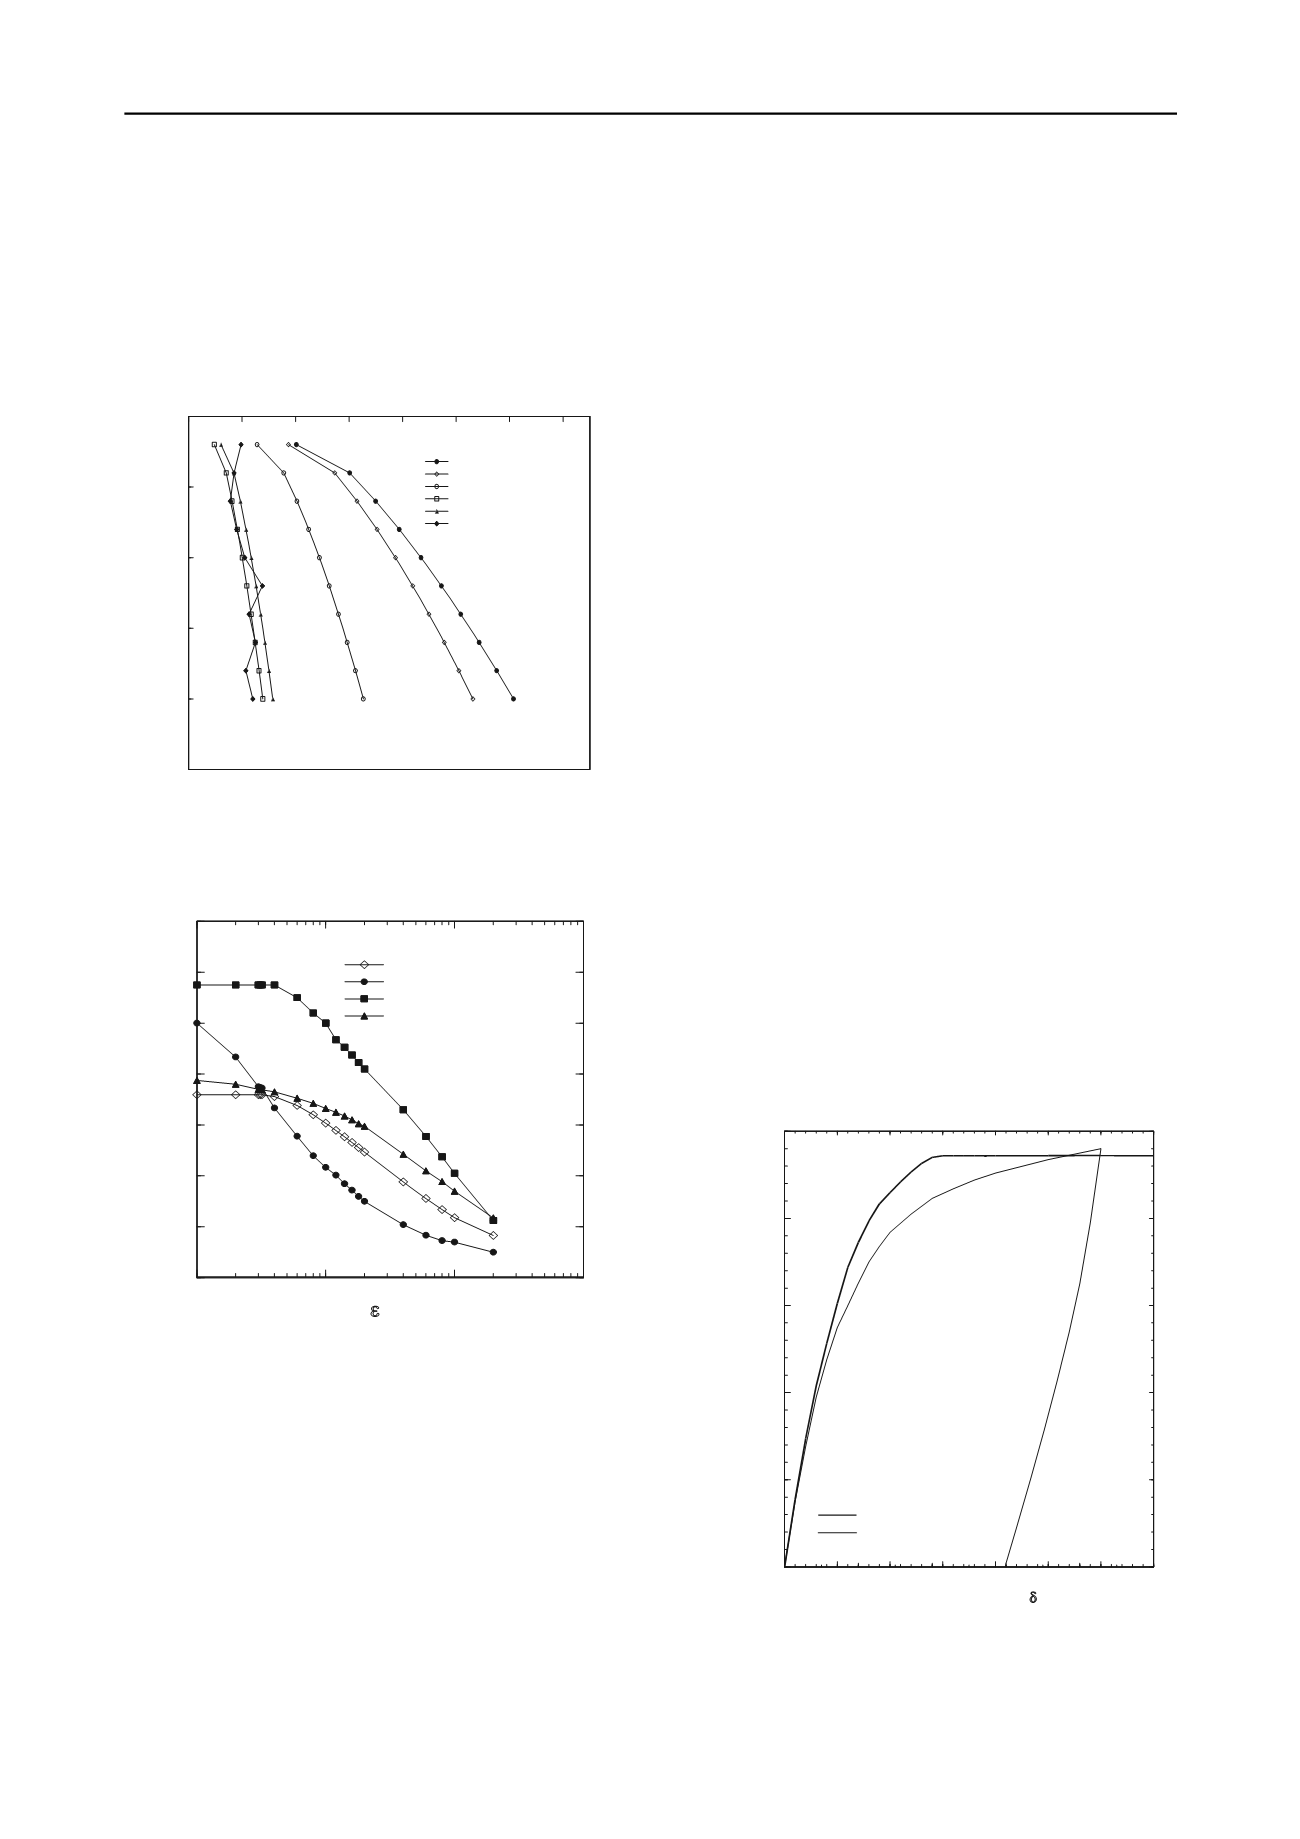
The sand’s marked quasi-elastic stiffness anisotropy is
clearly evident. Under OCR = 1, K
0
conditions the E'
v
/E'
h
ratio is
~ 1.7 while E'
v
/G
vh
~ 3.9. The pattern of anisotropy varies with
OCR and applied K ratio. The field quasi-elastic seismic CPT
G
vh
profile matches that from HCA Resonant Column tests by
Connolly 1998 and falls marginally (≈12%) above Kuwano’s
Bender Element G
vh
profile.
Fig 8. Quasi-elastic stiffness component profiles at Dunkerque. Seismic
CPT Gvh profile also shown: Jardine et al 2005a
Fig 9. Experimental shear stiffness-shear strain invariant curves with
ICFEP analysis curve: Jardine et al 2005a
The Dunkerque HCA and triaxial tests demonstrated how
stiffness anisotropy persists after Y
1
yielding and degrades with
strain. Fig. 9 illustrates the shear stiffness trends from undrained
TC (Triaxial Compression), TE (Triaxial Extension), which
should converge within the very small strain elastic region, along
with TS (HCA Torsional Shear) experiments. The stiffnesses are
normalised by p΄, as the stress level exponent was higher over
this range than in the ‘Y
1
bubble’ and approaches unity at 0.1%.
The tests on K
0
consolidated samples were all sheared from p΄=
200 kPa at OCR = 1. Higher stiffness ratios were developed in
other tests conducted at OCR = 2; Jardine et al 2005a.
Advanced laboratory testing offers the only means of making
such accurate measurements of the non-linear, time-dependent
and anisotropic behaviour of geomaterials and how they respond
to the general stress paths applied by field foundation loading.
3 COMPARING LABORATORY_BASED PREDICTIONS
WITH FIELD BEHAVIOUR
The degree of match between laboratory and field stiffness
trends was investigated through fully non-linear FE simulations
with the code ICFEP (Potts and Zdravkovic 1999, 2001).
Several of the ‘80 day’ Dunkerque tests were modelled. The key
aspects emphasised by Jardine et al 2005a were:
0
100 200 300 400 500 600 700
Elastic stiffness, MPa
0
5
10
15
20
25
Depth, m
Legend:
Eu from TXC tests
E`v from TXC tests
E`h from TX tests
Gvh from TX BE tests
Ghh from TX BE tests
Gvh from field seism. CPT tests
Meshing to accommodate eight ‘density’ sub-layers, based
on pile-specific CPTs, with bulk unit weights varying above
and below the water table from 17.1 to 20 kN/m
3
.
Following triaxial and direct shear tests by Kuwano 1999,
peak φ΄ values ranging between 35
o
and 32
o
for the dense-
to-loose sand sub-layers, dilation angles ψ = φ΄/2 and a
single pile-sand interface shear angle δ΄ = 28
o
.
Non-linear shear and bulk stiffnesses curves fitted to
laboratory test data with simple effective stress functions
from Jardine and Potts 1988 (after Jardine et al 1986).
Noting that pile loading imposes vertical shearing on the
shaft and axial loading at the base, a normalised ‘dense’
shear stiffness relationship was selected that was biased
towards the
OCR
= 1 torsional shear HCA curve in Fig. 9.
A normalised ‘dense’ bulk stiffness-volume strain curve
fitted from Kuwano’s swelling/re-compression tests and
adjusted to meet K
0
swelling effective stress path checks.
Softer stiffness curves (factored by 0.8) for the thin
‘organic’ loose sub-layers identified from the CPT traces.
0.001
0.01
0.1
1
s, %
0
200
400
600
800
1000
1200
1400
G/p'
Dunkerque dense sand secant shear stiffness data OCR=1
Legend:
Curve used for FE analysis
TC test curve OCR=1
TE test curve OCR=1
TS test curve for OCR=1
Effective stress regimes that were simplified to give
constant stress ratios σ
r
/σ
z0
near the pile shaft within each
block (where σ
z0
is the undisturbed vertical effective stress)
that decayed monotonically out to far-field K
0
values. The
shaft radial stresses were derived following the Jardine et al
2005b procedures, adjusted to account for the piles’ 80 day
ages. Estimates for how σ
θ
/σ
z0
and σ
z
/σ
z0
varied at points
away from the shaft could only be based on judgement.
Fig 10. Predicted and (end of load stage) measured load-displacement
curves: 80day test on R6: Jardine et al 2005a.
Figure 10 compares the non-linear FE analysis with the ‘end-
of-increment’ Q-δ envelope curve for pile R6 shown in Fig. 1.
0
5
10
15
20
25
30
35
Pile cap displacement,
(mm)
0
500
1000
1500
2000
2500
Pile resistance, Q (MN)
Legend:
predicted - ICFEP
observed


