49
Honour Lectures /
Conférences honorifiques
Proceedings of the 18
th
International Conference on Soil Mechanics and Geotechnical Engineering, Paris 2013
0
encouraging quantitative agreement when comparisons are made
between predictions and measurements made at h/R values up to
10; see for example the match between the common curves
given for h/R ≈ 6. Naturally, scope exists to consider further
factors such as: the effects of stress history on dilatancy and
shear strength; creep behaviour; and the extreme cyclic loading
that accompanies pile installation and leads to radial stresses
continuing to reduce with h/R at ratios greater than 10.
8 LABORATORY MODEL PILE TESTS TO
INVESTIGATE CYCLIC LOADING
The Mini-ICP Calibration Chamber experiments described in
Section 5 included multiple suites of axial cyclic loading tests
with the model piles installed into pressurised medium-dense NE
34 sand. Cycling was found to have a broadly similar effect on
axial capacity to that seen in the Dunkerque field tests. Figure 41
presents an overall interactive diagram which compares directly
with the field patterns in Fig. 3. Tsuha et al 2012 and Rimoy et al
2013 report on the cyclic stiffness and permanent displacement
trends. Broadly, they classify responses to cycling as:
Stable:
capacity increasing slightly, displacements small
and stabilising) over 1000 or more cycles
Unstable
: reaching failure with 100 cycles, or
Metastable
: falling between these limits
A particular advantage offered by the laboratory model pile
arrangements shown in Figs. 22 and 23 was the ability to
measure the pile-sand effective stress path response directly,
both at the shaft interface (with the Mini-pile’s leading,
Following and Trailing Surface Stress Transducers) and within
the sand mass by the sand-stress senor arrays.
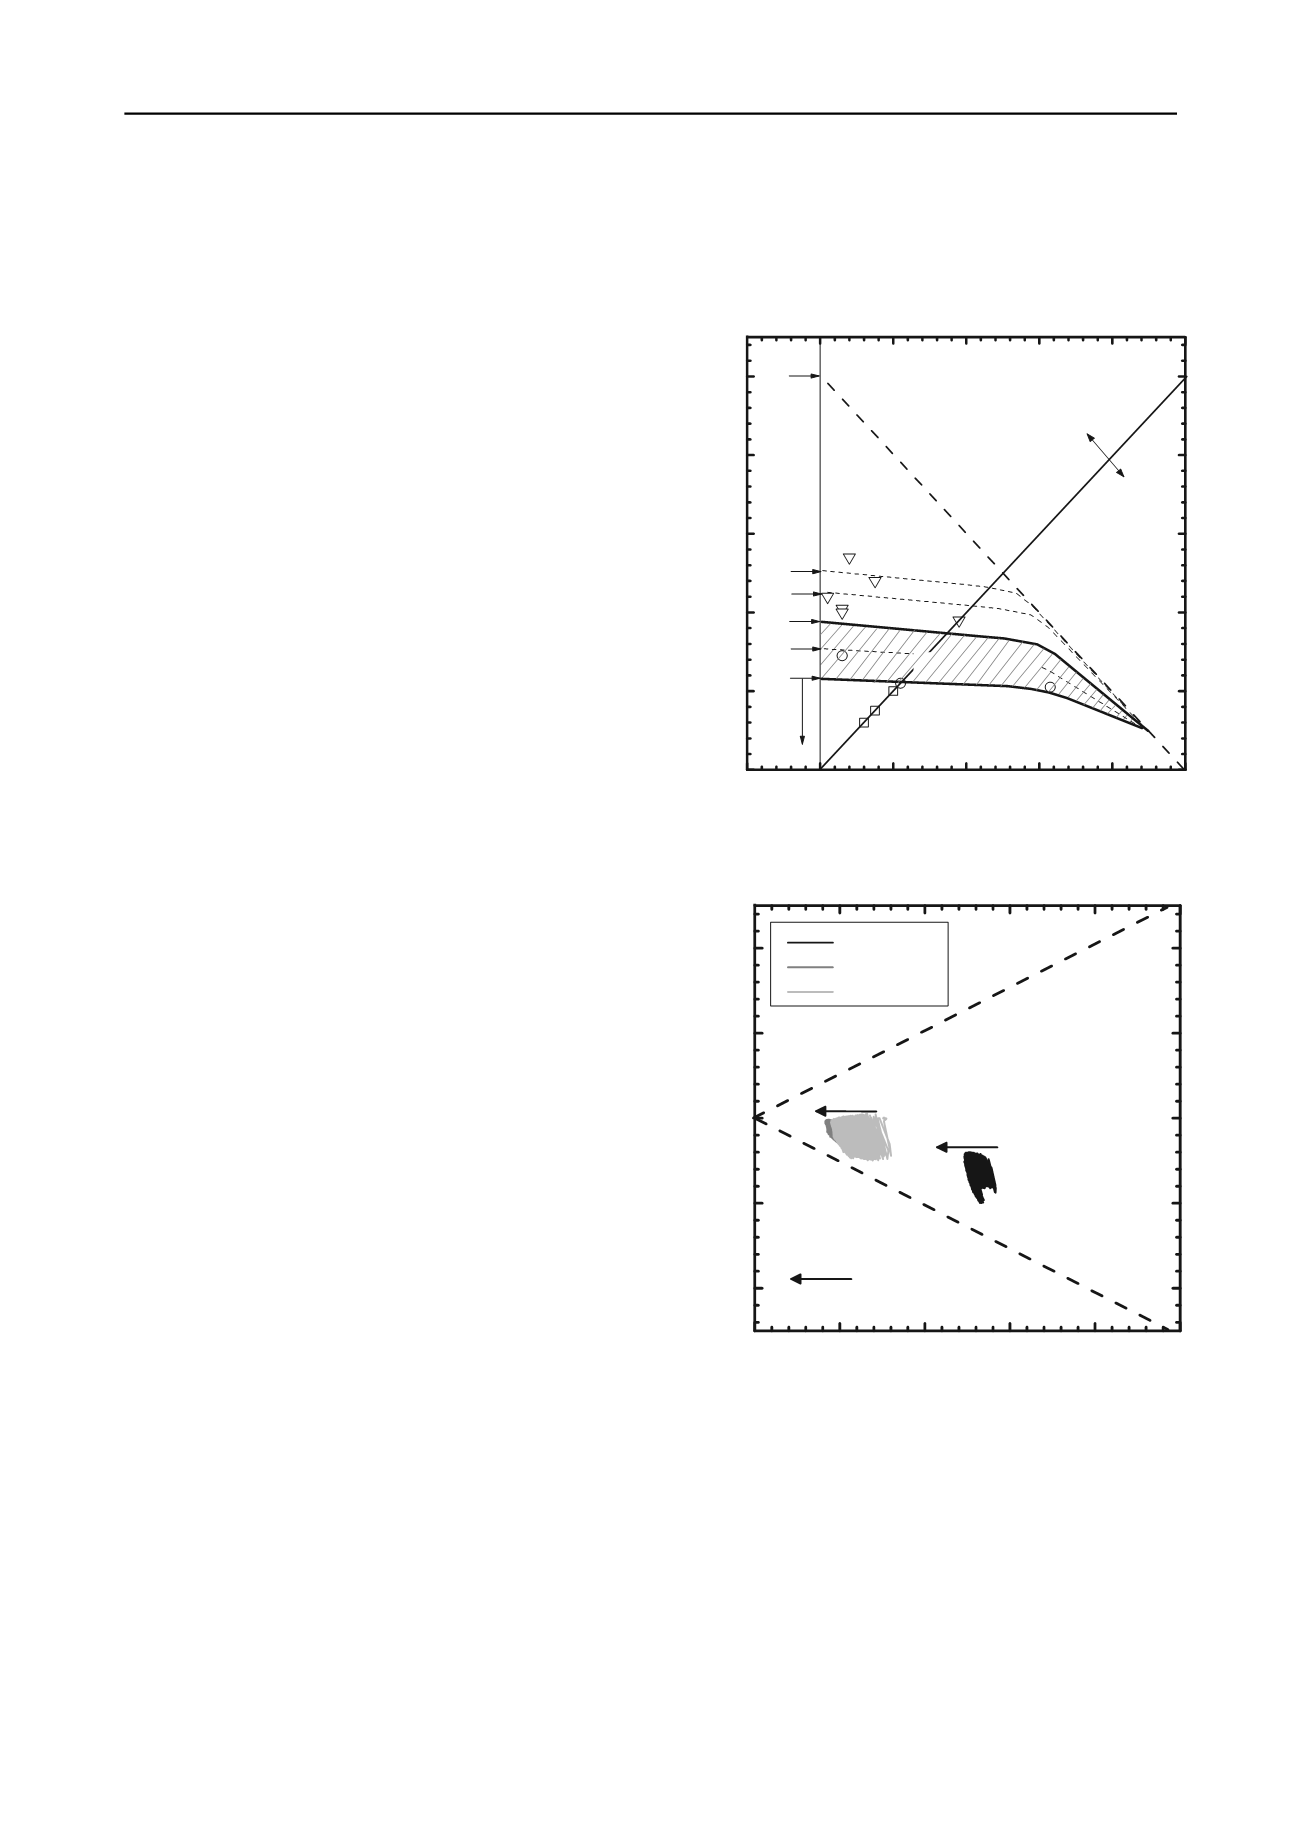
Figure 42 illustrates the local interface effective stress paths
followed under Stable conditions in a 1000 cycle experiment.
The patterns resemble those seen in Constant Normal Stiffness
(CNS) shear experiments (see for example Boulon & Foray 1986
or Dejong et al 2003) with radial effective stresses increasing
under tension loading (that generates negative shaft shear stress)
and decreasing under compressive load increments around the
relatively rigid Mini-ICPs. While the load-displacement response
is in-elastic (non-linear and hysteretic) under even low-level
cycling, the radial effective stress changes and pile head
movements induced by each cycle are small.
The effective stress paths appear to match, approximately,
the Y
2
criteria described in Section 2 and traced by Kuwano and
Jardine 2007 in small strain triaxial probing tests. Rather than
remain exactly static, the radial stresses reduced, albeit at very
slow rates, over time indicating a tendency towards contraction
and migration towards the interface shear failure criterion angles
established by Yang et al 2010 through interface ring shear tests,
or those shown in Fig. 34 from Ho et al 2011. The continuing
rates of radial stress reduction might also be related to very slow
rates of continuing interface surface abrasion and particle
modification.
Multiple static tension tests on the Mini-ICPs showed shaft
capacities increasing (by up to 20%) as a result of stable cycling,
mainly due to changes in loading stress-path geometry that gave
a less contractive response under static loading. The Dunkerque
field tests also showed tension capacity increasing after a stable
1000 cycle test; Jardine and Standing 2013. Figures 43 and 44
demonstrate the contrasting responses seen in Metastable tests
under One-Way (OW) and Two-Way (TW) loading respectively.
All paths approach the interface failure envelope as cycling
continues, either asymmetrically under OW loading or more
symmetrically in the TW test. The milder OW test shows a
similar pattern to the Stable test shown in Fig. 40, except that it
migrates more rapidly and engages the critical δ= 27
o
failure
line, leading to the onset of local slip after several hundred load
controlled cycles. The more severe TW test progressed further
and developed a full failure system with a ‘butterfly-wing’
effective stress path pattern resulting from slip displacements
that generated dilatant loading stages followed by sharply
contractant unloading stages.
-0.2 0.0
0.2
0.4
0.6
0.8
1.
0.0
0.2
0.4
0.6
0.8
1.0
N
f
= number of cycles to failure
One way
Q
cyclic
/Q
T
Q
mean
/Q
T
Two way
Stable
Meta-Stable
Unstable
>1000
N
f
=
1
10
100
1
4
10
66
170
4
500
1000
500
5
Fig. 41. Effects on shaft capacity of cyclic loading. Interactive
stability diagram from Mini-ICP CC tests: Tsuha et al 2012.
0
100 200 300 400 500
-200
-100
0
100
200
'
=27
o
Shear stress
rz
(kPa)
Radial stress
'
r
(kPa)
Leading A
Following B
Trailing C
Direction of
radial stresses
Fig. 42. Interface shear τ
rz
- σ΄
r
effective stress paths: Stable
cyclic test ICP4-OW1: Tsuha et al 2012.
Close examination reveals the top-down progressive failure
process described by Jardine 1991, 1994. The points where
behaviour switches from contractant to dilatant fall on an
interface Phase Transformation line analogous to that noted by
Ishihara et al 1975.


