46
Proceedings of the 18
th
International Conference on Soil Mechanics and Geotechnical Engineering, Paris 2013
Proceedings of the 18
th
International Conference on Soil Mechanics and Geotechnical Engineering, Paris 2013
advanced and the cyclic interface shearing caused by jacking
promoted further shear abrasion.
Figure 31 displays the progressively increasing breakage
from the fresh sand through Zones III, II to the interface Zone I,
where about 20% of the sand comprises fragments finer than the
smallest grains present in the parent NE 34. Image analysis
showed that the Zone 1 sand has similar sphericity and convexity
to fresh NE 34 while diffraction analyses showed quartz contents
(99.6%) just 0.1% lower than for intact NE 34.
10
100
1000
0
20
40
60
80
100
cumulative percentage (%)
particle size (
m)
Fresh sand
Average of Zone 1
Average of Zone 2
Average of Zone 3
Average of Zone 1-2
Fig. 31. Optical grain size distributions defined by Feret mimima for
fresh NE34 sand and Zones 1 to 3: Yang et al 2010
The pile surface was also modified. Multiple Rank Hobson
Talysurf measurements showed that the maximum surface
roughness declined from around 33 to 22μm, while the centre
line average values fell from 3.8 to 2.8μm. The abraded 1μm
thickness of stainless steel would have contributed less than
1/1000
th
of the average thickness (≈ 1mm) of the interface shear
zone, which is compatible with the very slightly (0.1%) lower
quartz content of the Zone 1 material.
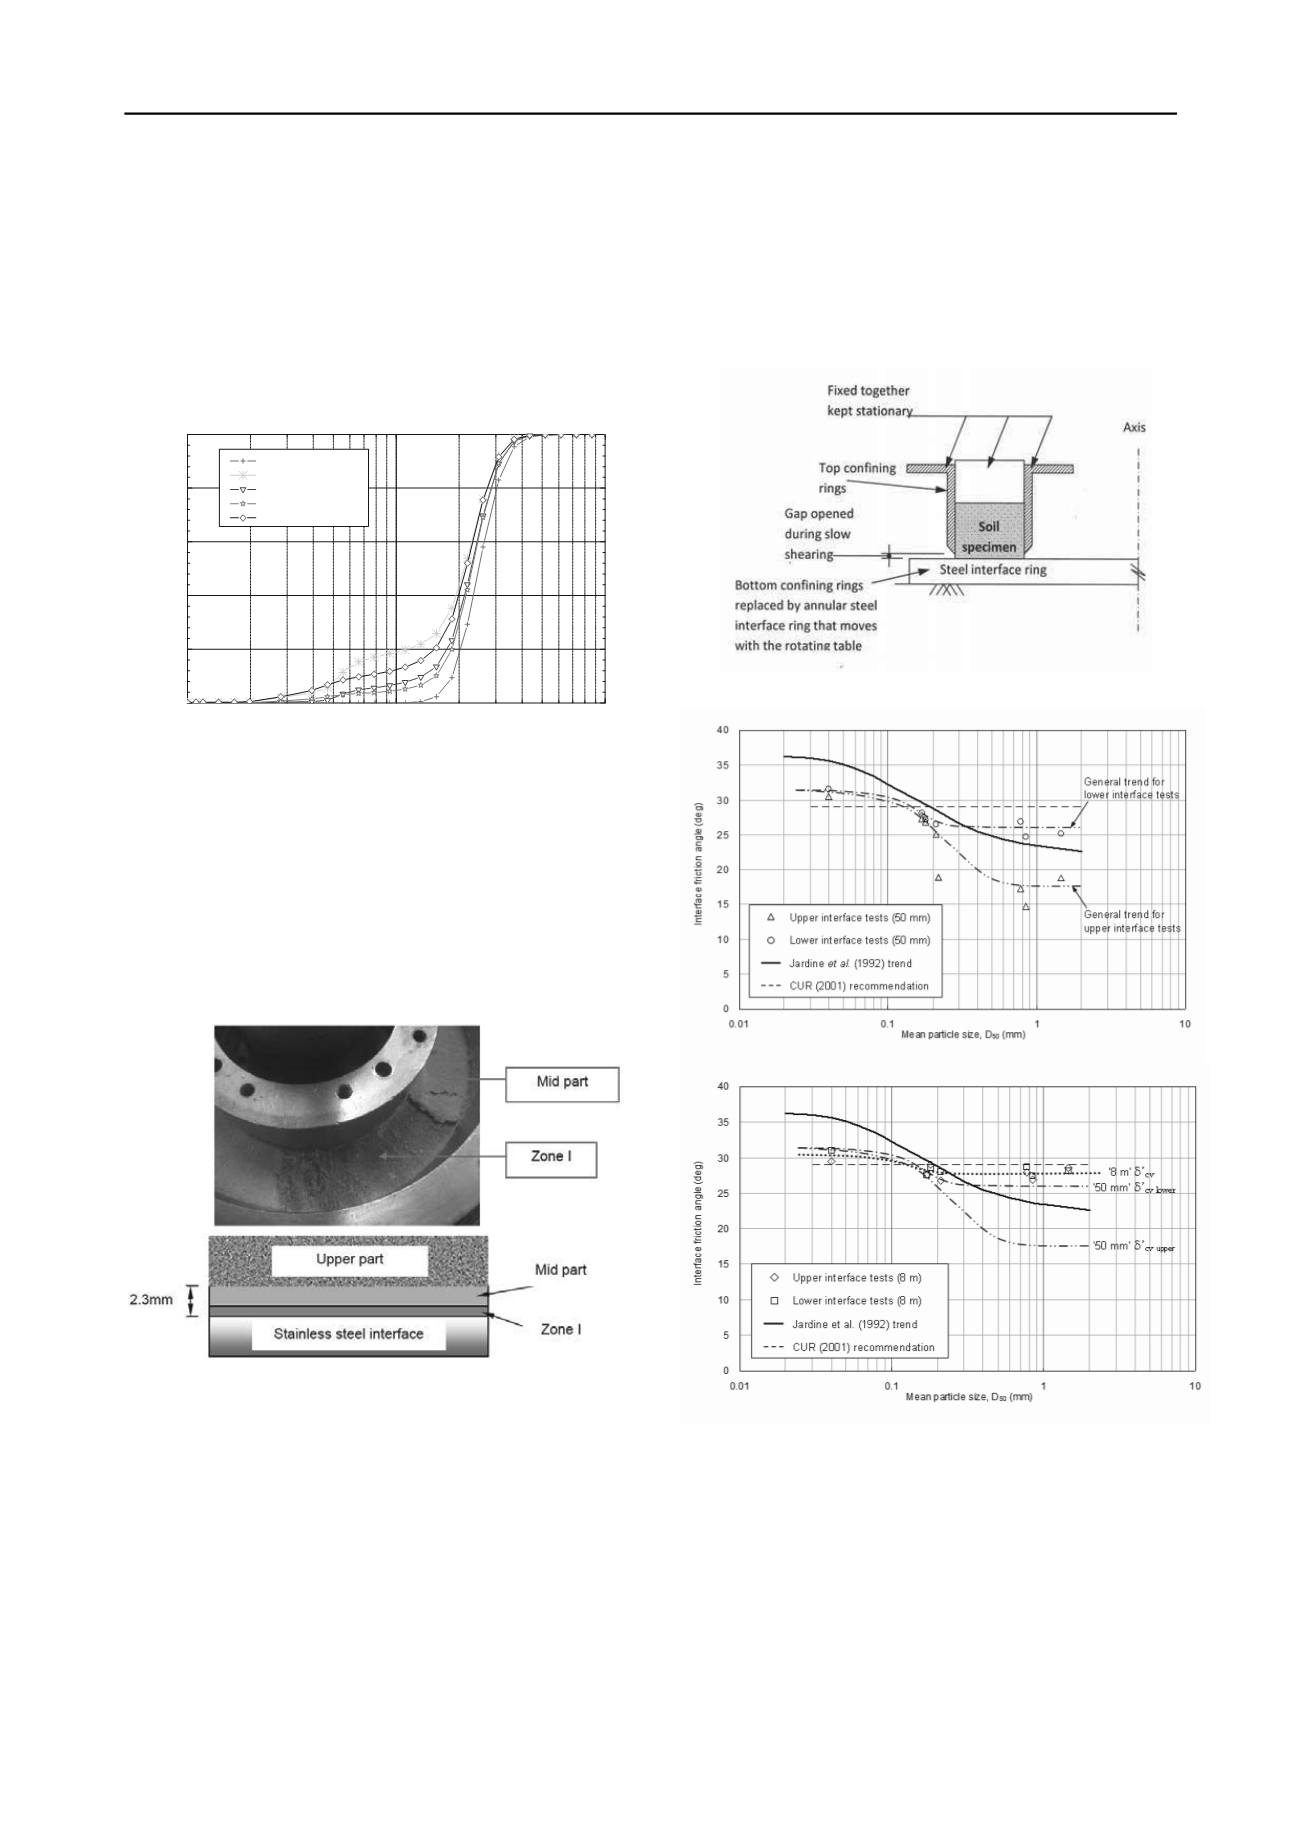
Fig. 32. Photograph and scheme of shear zones from interface ring shear
tests on NE 34 sand; after Yang et al 2010
Parallel interface ring-shear experiments were conducted with
a modified version of the Bishop et al 1971 equipment, shearing
NE 34 against surfaces identical to the pile shaft, at normal
stresses up to 800 kPa. These tests also developed grey ‘Zone 1’
shear bands, as illustrated in Fig. 32, although the bands were
thinner and had lower percentages of broken grains than those
adjacent to the model piles. Ring-shear tests employing the
lower interface configuration shown in Fig. 33 did not reproduce
the high pressure pile tip breakage conditions, but led to closely
comparable δ = tan
-1
(τ
zh
/σ΄
z
) angles to the pile tests that were
practically independent of stress level over 100 < σ΄
z
< 800 kPa.
Ho et al 2011 extended the study, covering a wider range of
gradings with seven silica sands and silts (including NE 34 and
TVS) in ring-shear tests involving interfaces positioned both
above and below the sand samples. Their sweep of δ angles
against d
50
is shown in Fig. 34 where the upper plot (a) shows
trends after shearing to 50mm, while the lower (b) indicates
those after 8m of shear displacement. Also shown are the
‘critical state’ trends suggested by Jardine et al 1992 from low
displacement (5mm) direct-shear interface tests, and by CUR
2001 from cyclic shear box interface tests.
Fig. 33. Lower interface configuration for ring shear tests: Ho et al 2011
Fig. 34. Friction angles from ring shear tests against stainless steel
interfaces with initial CLA roughnesses of 3 to 4μm. Upper (a) results
after 50mm shear displacements, lower (b) after 8m; Ho et al 2011.
It is clear that the angles previously interpreted as stable ‘critical
state’ values in fact vary with test conditions:
The lower interface arrangement led, with d
50
> 0.2mm
sands, to lesser δ angles after 50mm displacements than
equivalent upper interface tests, where fine fragments can
fall from above into void spaces beneath the shear zone.
Lower interface ring-shear tests gave similar trends at 50mm
displacement to (5mm) direct shear interface tests.


