32
Proceedings of the 18
th
International Conference on Soil Mechanics and Geotechnical Engineering, Paris 2013
Proceedings of the 18
th
International Conference on Soil Mechanics and Geotechnical Engineering, Paris 2013
thereof, and model used for the calculation. The factor of safety
is often expressed as the ratio of the resisting forces to the driv-
ing forces. For a slope to be stable, the stabilizing forces (mo-
ments) should be larger than the driving (destabilizing) forces.
If there was no uncertainty in the safety factor, a safety fac-
tor of 1.05 would be sufficient. However there is uncertainty in
nearly all the parameters that enter the analysis of the stability
of a slope. There will therefore always be a finite probability
that the slope will fail. Defining the level of the finite probabil-
ity that is tolerable is the challenge. The geotechnical engineer
should provide insight in this discussion.
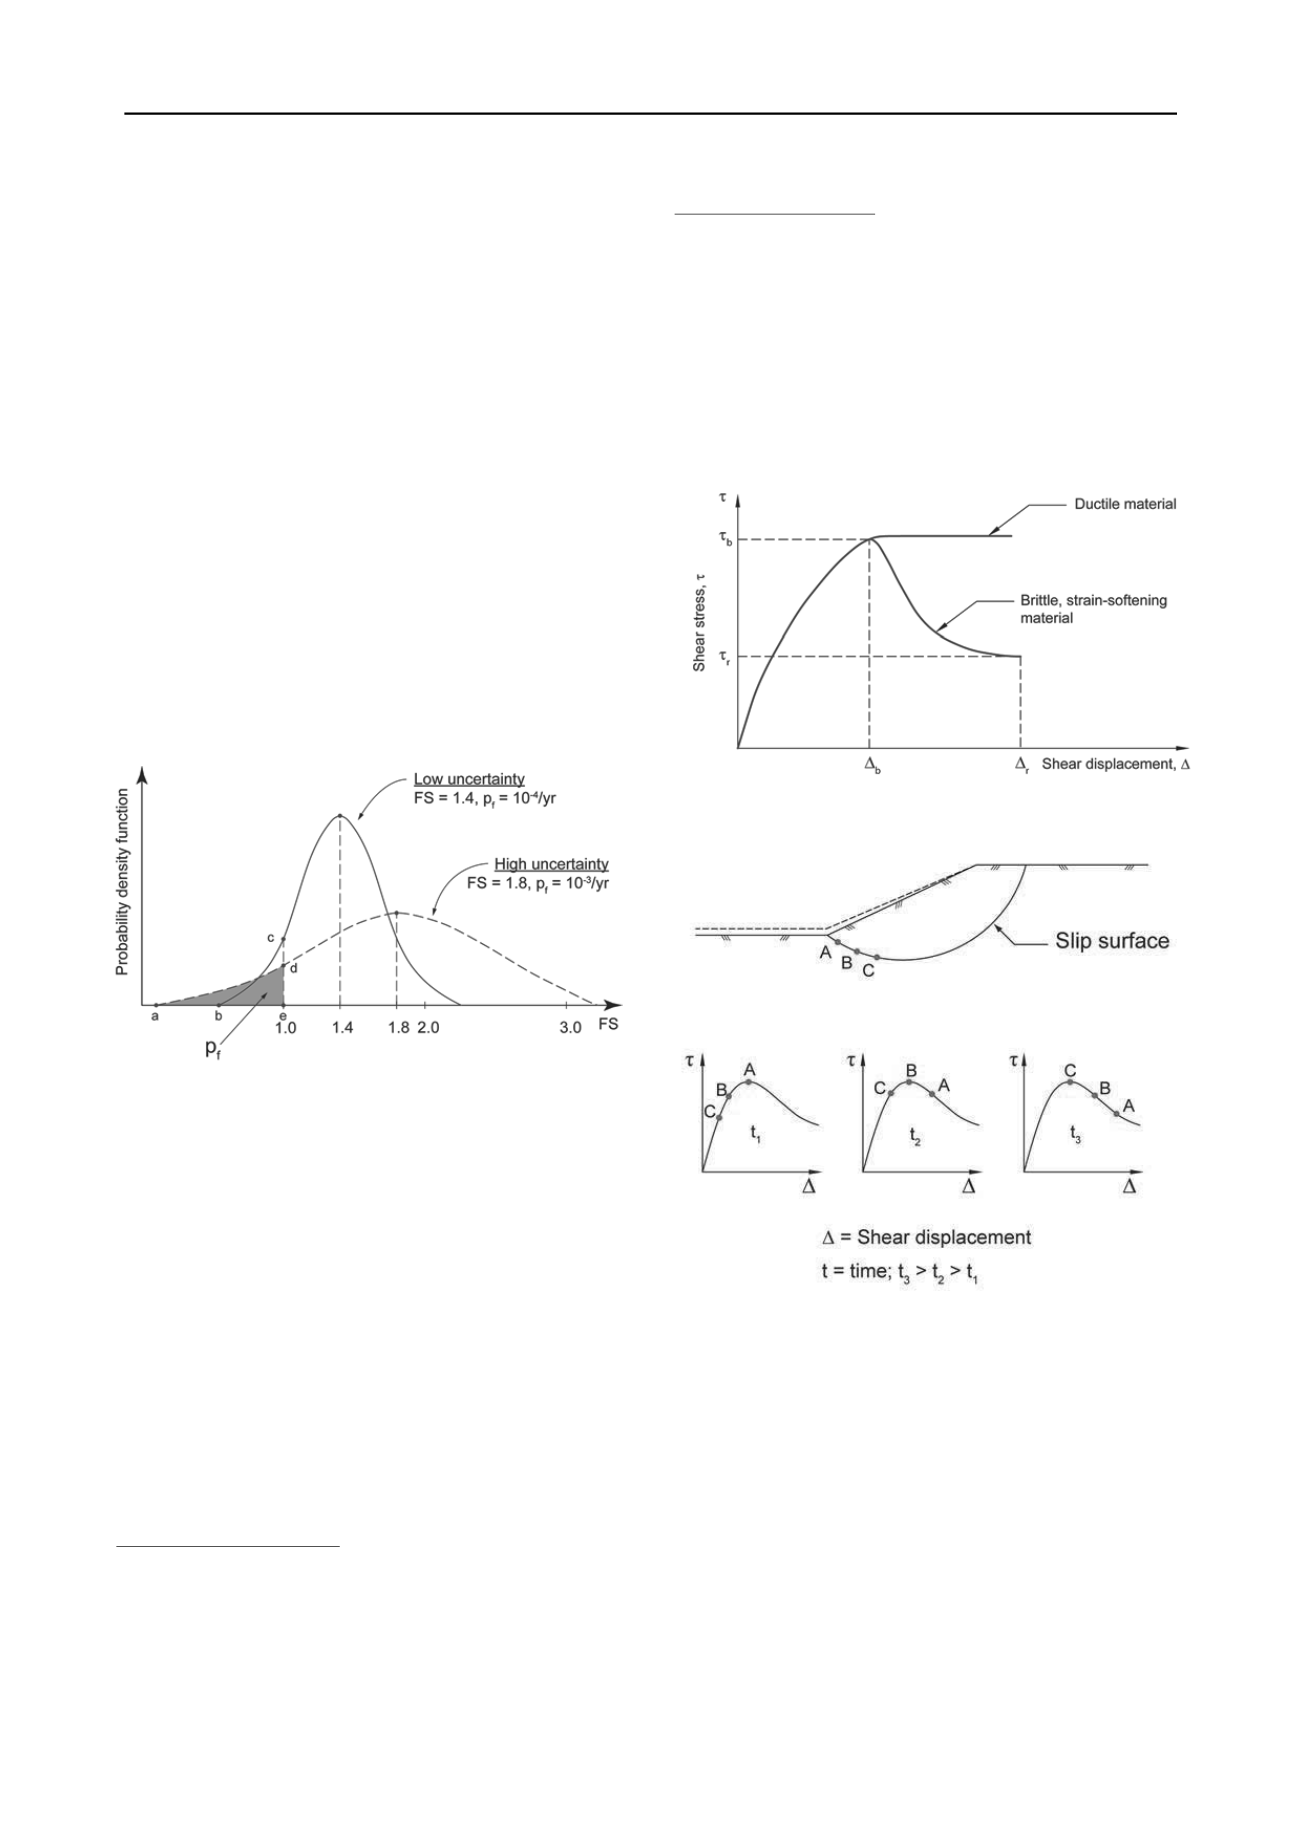
Figure 37 illustrates with probability density functions the
notion that factor of safety alone is not a sufficient measure of
the margin of safety. The figure gives the probability density
function (PDF) for two slopes. The first has a central FS (or SF
based on mean values) of 1.4 and a probability of failure, P
f
, of
10
-4
per year. The probability of failure is illustrated by the area
ace
where the factor of safety can be less than unity. The second
slope has a more diffuse PDF, has a higher FS of 1.8, but also a
higher probability of failure, P
f
, of 10
-3
per year (zone
aed
). In
order to select a suitable factor of safety, one therefore needs to
estimate the uncertainties involved. There exists no relationship
between safety factor based on limit equilibrium analysis and
annual probability of failure. Any relationship would be site-
specific and depend on the uncertainties in the analysis.
Figure 37. Factor of safety and probability of failure.
The safety factor should not be a constant deterministic
value, but should be adjusted according to the level of uncer-
tainty. Ideally, given time and money, one could calibrate the
required safety factor for different classes of slopes, soils and
failure types that would ensure a target annual probability of
failure of for example 10
-3
or 10
-4
per year.
In most cases, after a slide has occurred, it is difficult to de-
termine a unique trigger for the slide. Whether a material is duc-
tile or brittle (Fig. 38) is a very important factor that causes un-
certainty in the shear strength to use and how well the failure
mechanism of the slope is captured and modelled in the stability
analyses. The strain-softening of the brittle material is espe-
cially problematic, as it will show reduced resistance once a
threshold shear deformation has been exceeded (
b
in Fig. 38).
The stability conditions are especially difficult to analyse, e.g.
for the Vestfossen and the Kattmarka landslides.
Landslides can be triggered by natural causes (geological,
geomorphological or hydrological/meteorological processes) or
by human intervention. Triggers can be:
Reduction of soil resistance:
increase in pore pressure (artesian pressure, rainfall etc);
cracks on top of slope;
swelling;
chemical changes;
reduction of shear strength towards residual strength;
creep deformations;
vibrations with temporary increase in pore pressure;
rainfall (intensity and duration).
Increase in driving forces
increase in external loads;
pore pressure in weakness zones;
frost in fissures;
increase in unit weight due to rainfall;
excavation or erosion at toe of slope;
lowering of water table;
earthquake loading.
Figure 39 illustrates the development of a progressive failure in
a strain-softening soil. The displacement along the slip surface
varies between the toe and the top of the slope. One therefore
needs to include strain compatibility in the analyses.
Figure 38. Brittle and strain-softening material
Figure 39. Illustration of progressive failure.
For sensitive clays in Norway, the average mobilized shear
stress along different slip surfaces is compared with the corre-
sponding characteristic average shear strength divided by a ma-
terial coefficient,
γ
M
.
The requirement in Norway for the material coefficient
γ
M
is
1.4 (NVE 2011), and this
γ
M
should be used in design. However,
for an existing (standing) slope with a material coefficient less
than 1.4, NVE requires that the back-calculated material coeffi-
cient should be increased, but not necessarily to as much as 1.4.
Figure 40 illustrates the NVE requirement.
The required
γ
M
is a function of the initial back-calculated
material coefficient and the improvement required. The im-
provement required depends on the hazard class (NVE 2011).
The upper diagram in Figure 40 gives the minimum required in-
crease in material coefficient
γ
M
, (in %), for two levels of slope
improvement: “Substantial improvement required” and “Im-
provement required”. The lower diagram provides the resulting


