 
          22
        
        
          Proceedings of the 18
        
        
          th
        
        
          International Conference on Soil Mechanics and Geotechnical Engineering, Paris 2013


            Proceedings of the 18


            th


            International Conference on Soil Mechanics and Geotechnical Engineering, Paris 2013


          and 18º, and perhaps 20º in sections close to the toe. The height
        
        
          of the slope involved in the sliding was about 22 m. The slide
        
        
          area had a width of 275 m parallel to the watercourse and a
        
        
          length of 150 m normal to the watercourse. A total area of
        
        
          54,000 m
        
        
          2
        
        
          was affected by the landslide.
        
        
          The morphology of the slide was typical of a spread (Varnes,
        
        
          1078). The debris were a succession of long slices of deformed
        
        
          and dislocated material oriented normal to the direction of
        
        
          movement. Some of the debris took the form of a triangular
        
        
          prism and reminded of horsts, and these were displaced horizon-
        
        
          tally only. The horsts were separated by slices of relatively
        
        
          undisturbed material, just like a block having dropped due to
        
        
          some sort of faulting, and were called grabens (Fig. 18). In the
        
        
          back part of the slide, some blocks coming from an upper
        
        
          failure surface were pushed upward by movement and
        
        
          overlapped the adjacent lower slices.
        
        
          The investigation of the landslide was carried out by the
        
        
          Geotechnical and Geological Department of the Ministry of
        
        
          Transportation of Québec (Locat


            et al


          2011).
        
        
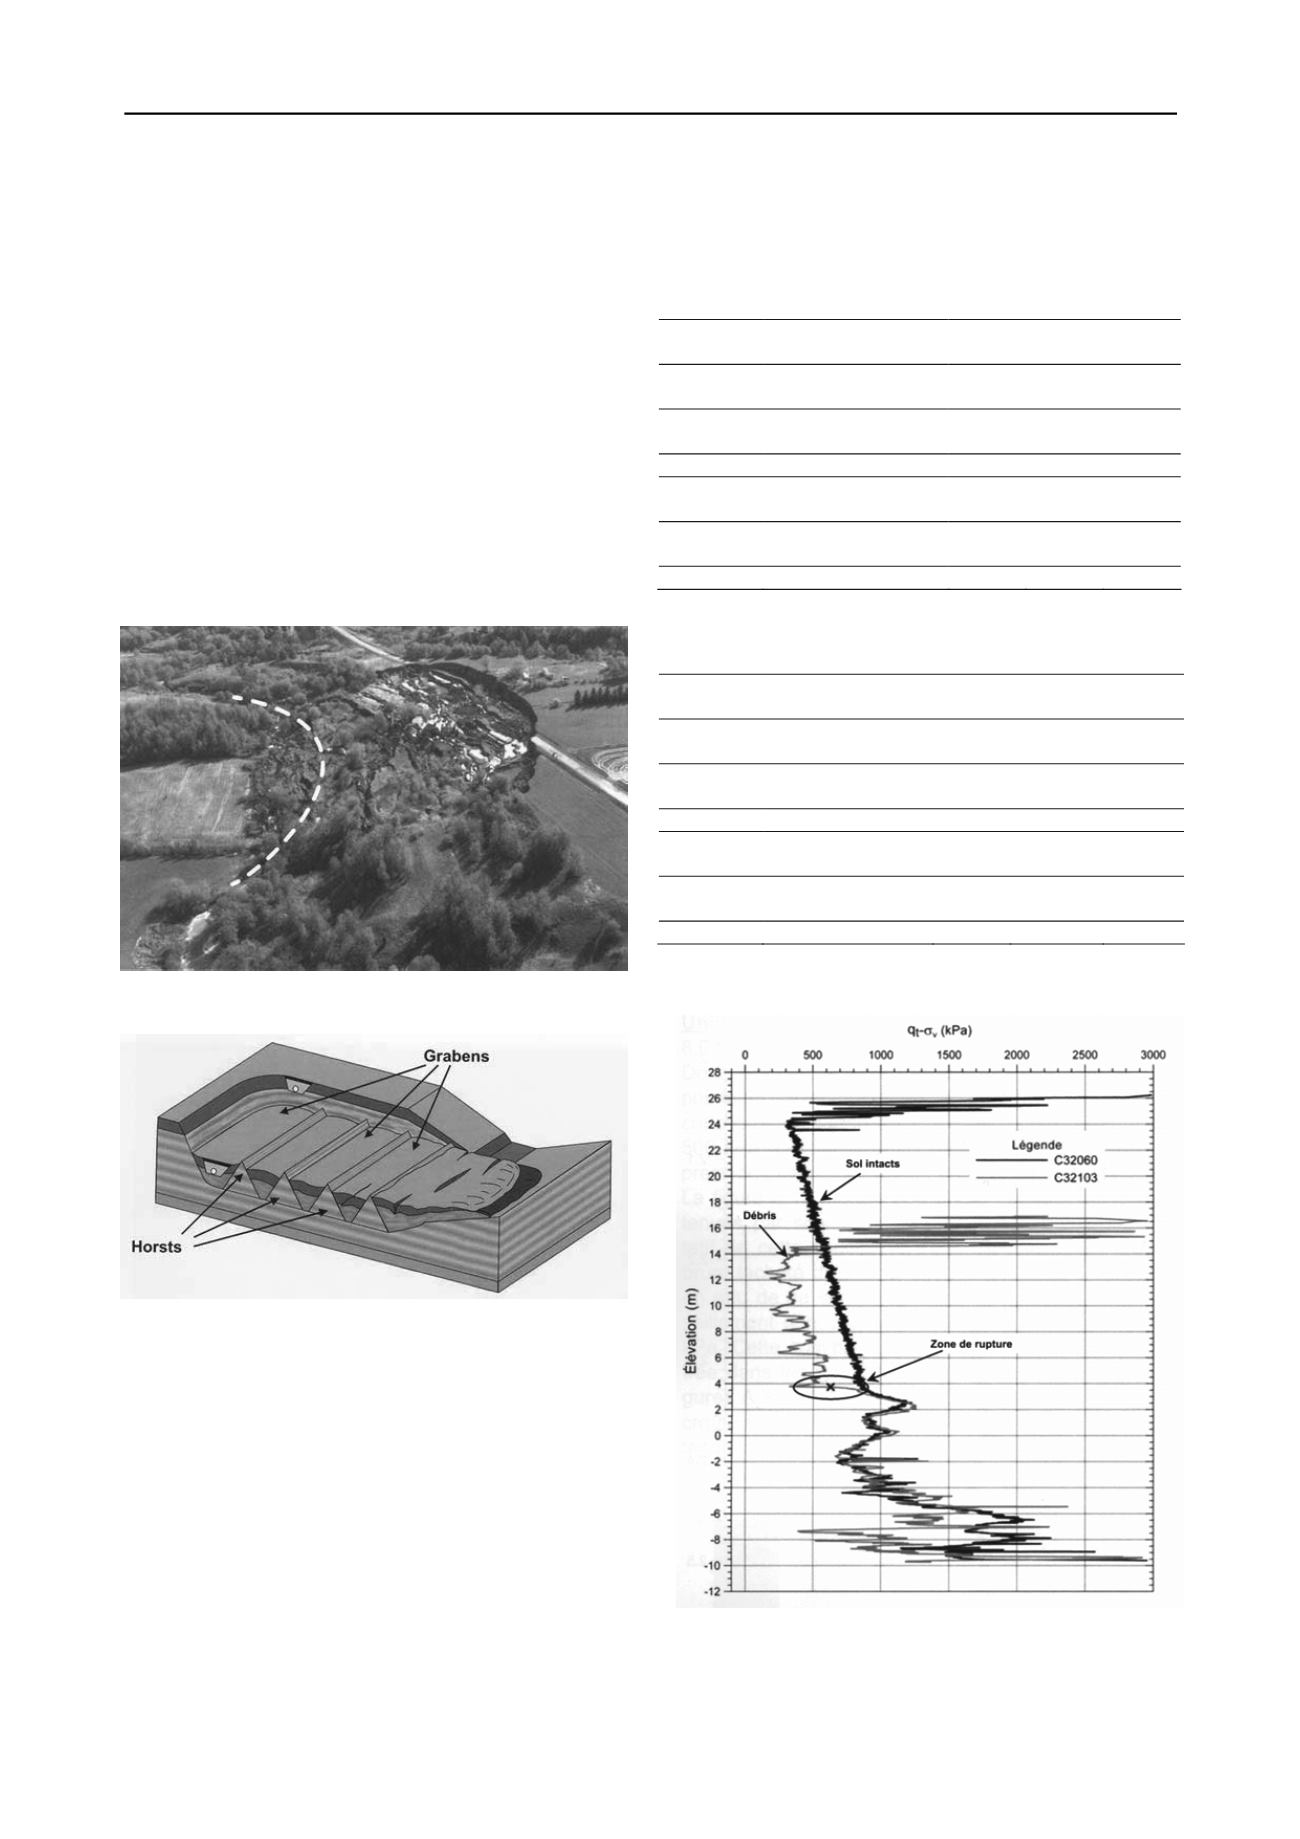
          Figure 17. Saint-Jude landslide and location of Salvail river (dashed
        
        
          line) (Locat


            et al


          2011).
        
        
          Figure 18. Saint-Jude landslide: illustration of the horsts and grabens af-
        
        
          ter the slide (Locat


            et al


          2011).
        
        
          6.2


            Soil parameters


          The soils involved in the landslide are mainly marine clay from
        
        
          the former Champlain Sea. The clay was sensitive, of medium
        
        
          to firm consistency, and had sensitivity ranging from 30 to 80
        
        
          and liquidity index decreasing form 2 to 1 with depth. There
        
        
          was artesian pressure of 10 m above the river level at the land-
        
        
          slide site. Table 7 and 8 describe a typical soil profile.
        
        
          Figure 19 gives an example of the cone resistance measured
        
        
          at the site after the failure. The profiling enabled the determina-
        
        
          tion of the location of the slip surface (Elevation +4 in Fig. 19).
        
        
          6.3


            Analysis of the landslide


          The analysis of the available data revealed that landslides had
        
        
          occurred earlier along the Salvail River. Aerial photographs
        
        
          since 1950 showed that erosion was active more or less steadily
        
        
          at the foot of the slope and that small landslides associated with
        
        
          erosion had occurred. The erosion seemed to have intensified
        
        
          over the past 15 years.
        
        
          Table 7. Index properties, Saint-Jude slide (after Locat


            et al


          2011).
        
        
          Depth
        
        
          (m)
        
        
          Soil description
        
        
          w
        
        
          (%)
        
        
          I
        
        
          p
        
        
          (%)
        
        
          I
        
        
          L
        
        
          0-3.8
        
        
          Drying crust, sandy,
        
        
          silty from 2 m
        
        
          24-78
        
        
          -
        
        
          -
        
        
          3.8-26
        
        
          Clay, some silt traces
        
        
          of sand
        
        
          65
        
        
          20-37
        
        
          2.0-1.0
        
        
          26-31
        
        
          Silty clay
        
        
          45-75
        
        
          21-37
        
        
          0.7-1.0
        
        
          31-37
        
        
          Silt, clayey, some
        
        
          sand, trace gravel
        
        
          15-25
        
        
          12-29
        
        
          0.5-1.5
        
        
          37-42.6
        
        
          Silt, sandy, some clay,
        
        
          trace gravel, v.dense
        
        
          13-18
        
        
          -
        
        
          -
        
        
          >42.6
        
        
          Shale and sandstone
        
        
          -
        
        
          -
        
        
          -
        
        
          w
        
        
          water content
        
        
          I
        
        
          p
        
        
          plasticity index
        
        
          I
        
        
          L
        
        
          liquidity index
        
        
          Table 8. Stress and strength characteristics, Saint-Jude slide location
        
        
          (after Locat


            et al


          2011).
        
        
          Depth
        
        
          (m)
        
        
          Soil description
        
        
          s
        
        
          u
        
        
          (kPa)
        
        
          p'
        
        
          c
        
        
          (kPa)


          (kN/m
        
        
          3
        
        
          )
        
        
          0-3.8
        
        
          Drying crust, sandy,
        
        
          silty from 2 m
        
        
          50-165
        
        
          250-400
        
        
          18.6
        
        
          3.8-26
        
        
          Clay, some silt
        
        
          traces of sand
        
        
          25-65
        
        
          100-260
        
        
          16.0
        
        
          26-31
        
        
          Clay, sandy
        
        
          50-107
        
        
          180-310
        
        
          16.8
        
        
          31-37
        
        
          Silt, clayey, some
        
        
          sand, trace gravel
        
        
          40-150
        
        
          -
        
        
          19.3
        
        
          37-42.6
        
        
          Silt, sandy, some
        
        
          clay, trace gravel
        
        
          -
        
        
          -
        
        
          20.7
        
        
          >42.6
        
        
          Shale and sandstone
        
        
          -
        
        
          -
        
        
          -
        
        
          s
        
        
          u
        
        
          undrained shear strength from field vane (CPTU N
        
        
          kt
        
        
          = 13.5)
        
        
          p'
        
        
          c
        
        
          preconsolidation stress (OCR = 1.4 at El. +15 and 1.0 at El. 0)


          soil unit weight
        
        
          Figure 19. Example of piezocone results in Saint-Jude deposit and indi-
        
        
          cation of slip surface at Elevation +4 (Locat


            et al


          2011).
        
        
          The slide is believed to have occurred as follows. Along the
        
        
          centreline of the slide, the slip surface developed at depth and