20
Proceedings of the 18
th
International Conference on Soil Mechanics and Geotechnical Engineering, Paris 2013
Proceedings of the 18
th
International Conference on Soil Mechanics and Geotechnical Engineering, Paris 2013
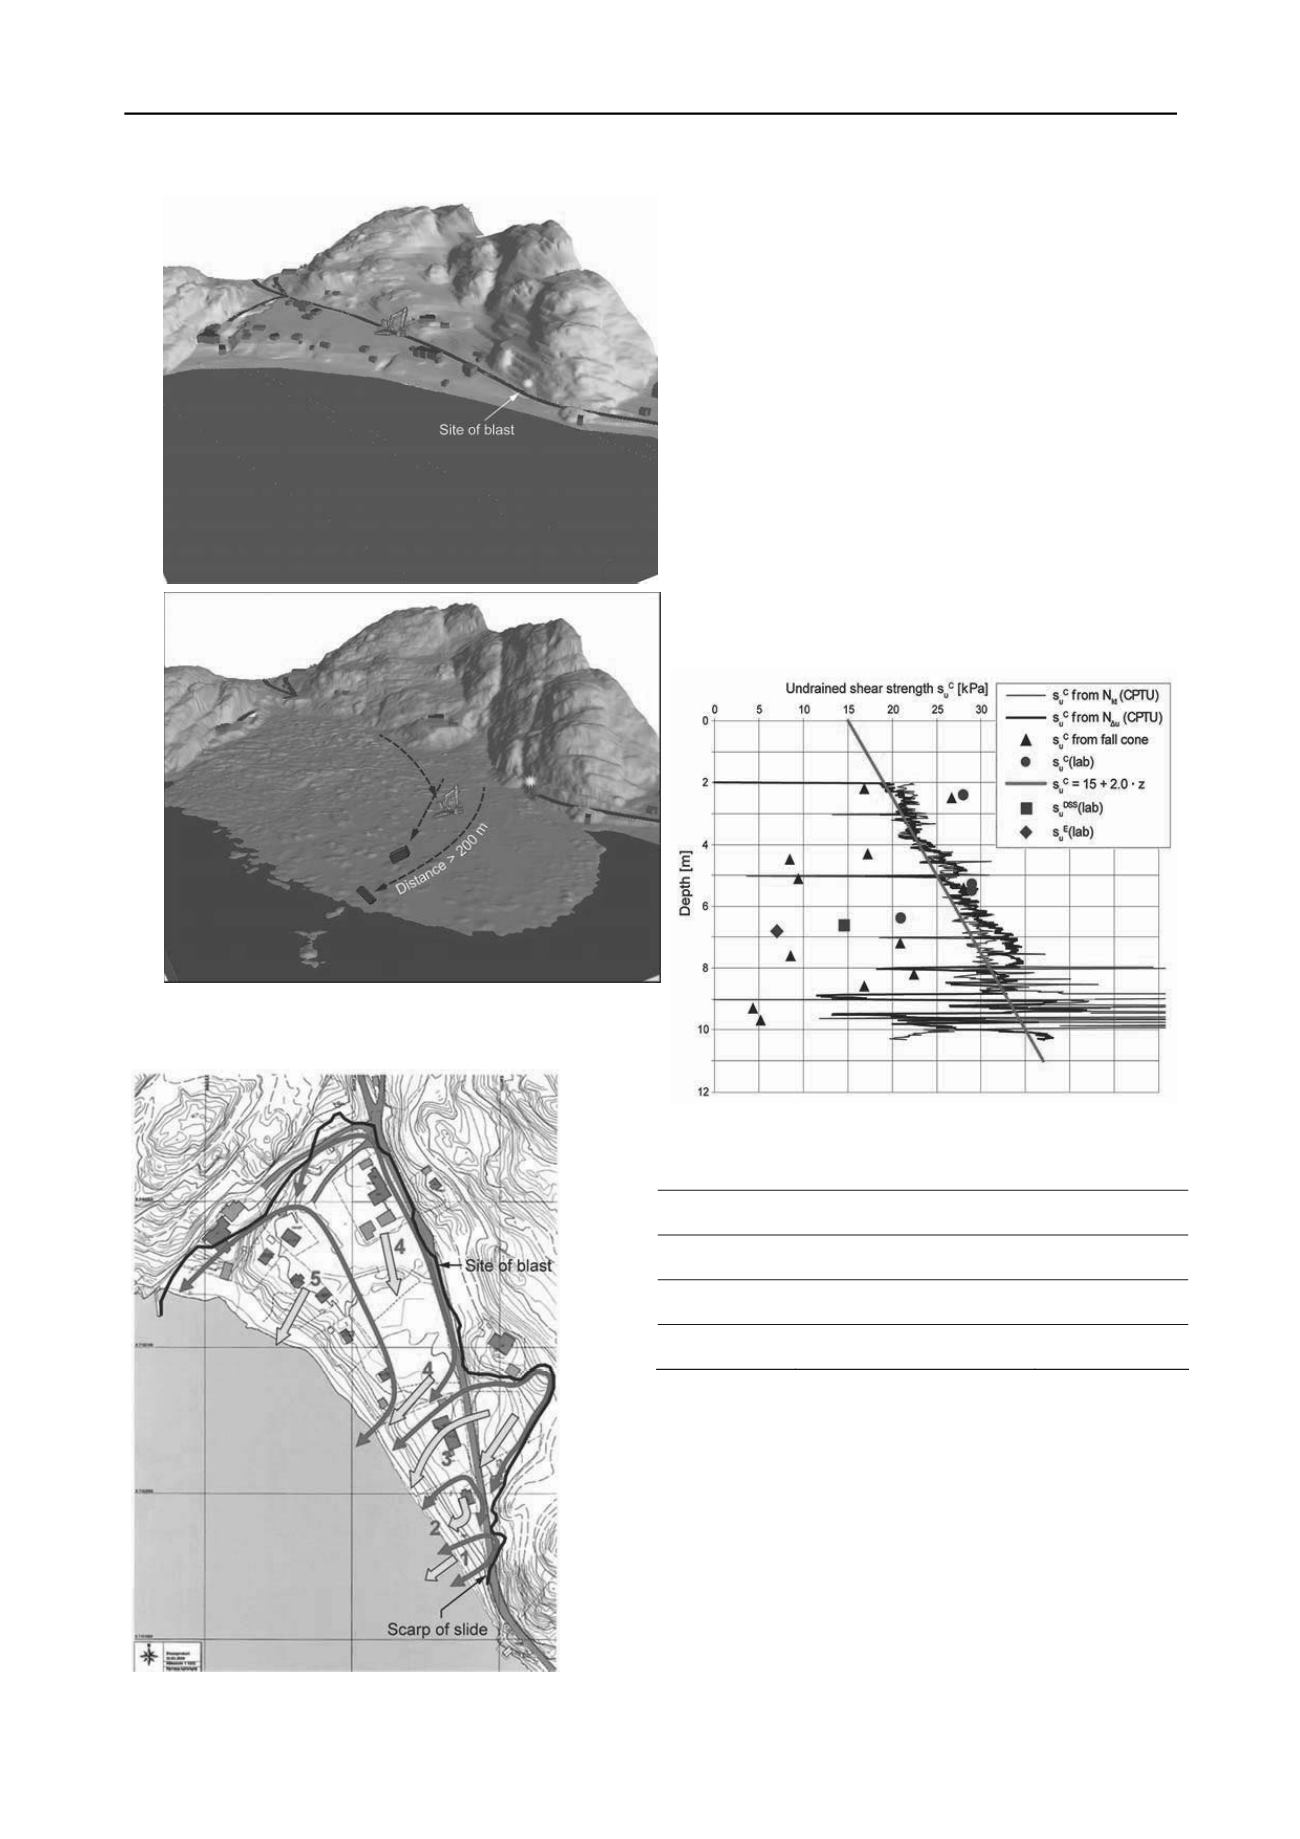
Figure 11. 3-D model of Kattmarka area before and after landslide (ter-
rain model from laser scanning plate) (NVE 2009).
Figure 12. Movement succession in Kattmarka (Nordal
et al
2009).
highly anisotropic with s
u
DSS
equal to 0.70 × s
u
C
and s
u
E
equal to
0.40 × s
u
C
, where
s
u
DSS
is the undrained shear strength from di-
rect simple shear tests, and s
u
E
is the undrained shear strength in
triaxial extension. In Figure 13, the undrained shear strength
values derived from the cone penetration test (CPTU) via the
cone factors N
kt
and N
u
. An analysis was done of the uncertain-
ties in the undrained shear strength, and it was concluded that
exceeding the value of the s
u
C
used in the analyses was less than
10 or 15%.
The analyses were done with the computer codes PLAXIS
and GeoSuite Stability (Lacasse
et al
2013). The NGI-ADP soil
model for anisotropic clays was used. The two programs gave
the same safety factors. The PLAXIS analyses were run with a
plane strain approximation, with partial compensation of the 3-
D effects with a stabilizing side shear. To model the condition
“After blasting, before sliding”, a zone of remoulded clay was
included immediately at the rock-clay interface, which dimen-
sion of 8 m by 4 m was based on observations
in situ
(after the
slide) and calculations of shear strains due to the blasting (Nor-
dal
et al
2009). Table 3 lists the resulting safety factors.
Figure 13. Undrained shear strength from laboratory and
in situ
tests
and profile selected for stability analyses.
Table 6. Factor of safety before sliding
Zone (Fig. 11)
Stability condition
Factor of safety,
FS
1
Before blasting
After blasting, before sliding
1.20
0.97
2
Before blasting
After blasting, before sliding
1.19
1.06
3
Before blasting
After blasting, before sliding
1.02
~0.90
The delay of ½ minute between the blast and the initiation of
the slide (visual observation) can be in part explained by rate ef-
fects, whereby the high frequency of the load caused an increase
in the strength, but as the clay at the top of the slope became
remoulded under the added load from the rock slipping and
pushing in the clay, the clay towards the bottom of the slope
could not support the added load. The overstressed area towards
the bottom of the slope in the Zone 3 cross-section is illustrated
in Figure 14.
Figure 15 illustrates the vertical interface rock-clay in Zone
1, and the blasting that triggered the slide. The cross-section af-
ter the slide is also shown on the figure. The location of the
blasting holes is only approximate on the figure, as it was diffi-
cult to reconstruct the exact locations in the aftermath of the
slide. The blast shot the rock face out about 1 meter into the


