16
Proceedings of the 18
th
International Conference on Soil Mechanics and Geotechnical Engineering, Paris 2013
Proceedings of the 18
th
International Conference on Soil Mechanics and Geotechnical Engineering, Paris 2013
SERVICE. Most of the increase is due to the increase in the ex-
posed population. However, many lives could have been saved
if more had been known about the risks associated with natural
disasters and risk mitigation measures had been implemented.
Urban development, increased infrastructure and rapid popula-
tion rise contribute to increasing the vulnerability of humans
and property to landslides.
While earthquakes, floods, tsunamis and storms receive wide
attention in the news, landslides are not recorded as a separate
hazard by Munich Re. The European statistics from the past 100
years in Table 3 give the social-economic impact of landslides
in Europe in the 20
th
century. The landslide frequency of about
20 major events per year in Europe is the highest compared to
floods, earthquakes and cyclones. However, the number of fa-
talities and the quantity of material damage is far greater for
earthquakes. Landslides are also frequently triggered by floods
and earthquakes and are not statistically recorded as landslides,
but as floods and earthquakes in the disaster databases.
Tragically, developing countries are more severely affected
by natural disasters than developed countries, especially in
terms of lives lost (UNDP 2004, UNISDR 2009 and IFRC
2004). Table 4 shows the data compiled by IFRC (2001) for the
decade 1991-2000. Of the total fatalities due to natural disasters,
the highly developed countries accounted for 5 % of the casual-
ties. In absolute numbers, the material damage and economic
loss due to natural hazards in highly developed countries by far
exceed those in developing nations. However, this reflects the
grossly disproportionate values of fixed assets, rather than ac-
tual economic vulnerability.
Table 2. Natural catastrophes in 2010 (Munich Re 2011)
Events and
losses(MUSD)
2010
2009
Average
2000-2009
Average
1980-2009
No. of events
950
900
785
615
Overall losses
130,000
60,000
110,000
95,000
Insured losses
37,000
22,000
35,000
23,000
No. fatalities
295,000
11,000
77,000
66,000
Table 3. Impact of natural disasters in Europe (1900-2000)
Disaster
Lose of life
Material damage
45 floods
10,000
105 B€
1700 landslides
16,000
200 B€
32 earthquakes
239,000
325 B€
Table 4. Natural disasters between 1991 and 2000 (IFRC 2001).
Countries
No. of disasters
No. of lives lost
Low & medium dev. Countries
1838
649,400
Highly developed countries
719
16,200
3 OVERVIEW OF CASE STUDIES
Professor Ralph B. Peck, Karl Terzaghi’s closest colleague, re-
lied heavily on case studies to learn from and to develop inno-
vative solutions. After Karl Terzaghi himself, no one has influ-
enced our practice as strongly as Ralph B. Peck with his 65
years of practice. Ralph Peck had a philosophy of simplicity of
communication, whereby “if you cannot reduce the presentation
of a difficult engineering problem to just one sheet of paper, you
will probably never understand it” (Course CE484, University
of Illinois; DiBiagio 2013). While achieving one-page summa-
ries for each case study was not possible in this Oration, an at-
tempt was made to stick to Ralph B. Peck’s philosophy. Each
case study is organized contains essentially four components:
1. Description of the landslide
2. Soil parameters
3. Analysis of the landslide
4. Lessons learned
The summaries do not contain all the details for each case study.
However, the details may be found in the references cited. Al-
though belonging to “after-the-fact” sagacity, lessons learned
will be especially focused upon.
The following case studies are included (section number is
given in parenthesis):
The Vestfossen slide in sensitive clay, Norway (4)
The Kattmarka slide triggered by blasting, Norway (5)
The Saint-Jude natural slope failure, Québec, Canada (6)
Recurrent sliding on Cap Lopez, Gabon (7)
The Ashcroft Thompson River landslides, BC, Canada (8)
The Aalesund slide, Norway (9)
The Storegga slide, NE Atlantic Continental margin (10).
The following landslide risk management examples are also
briefly presented:
Landslide prevention in Norway.
The SafeLand Project.
Slope safety in Hong Kong.
Preparedness.
A few recent developments.
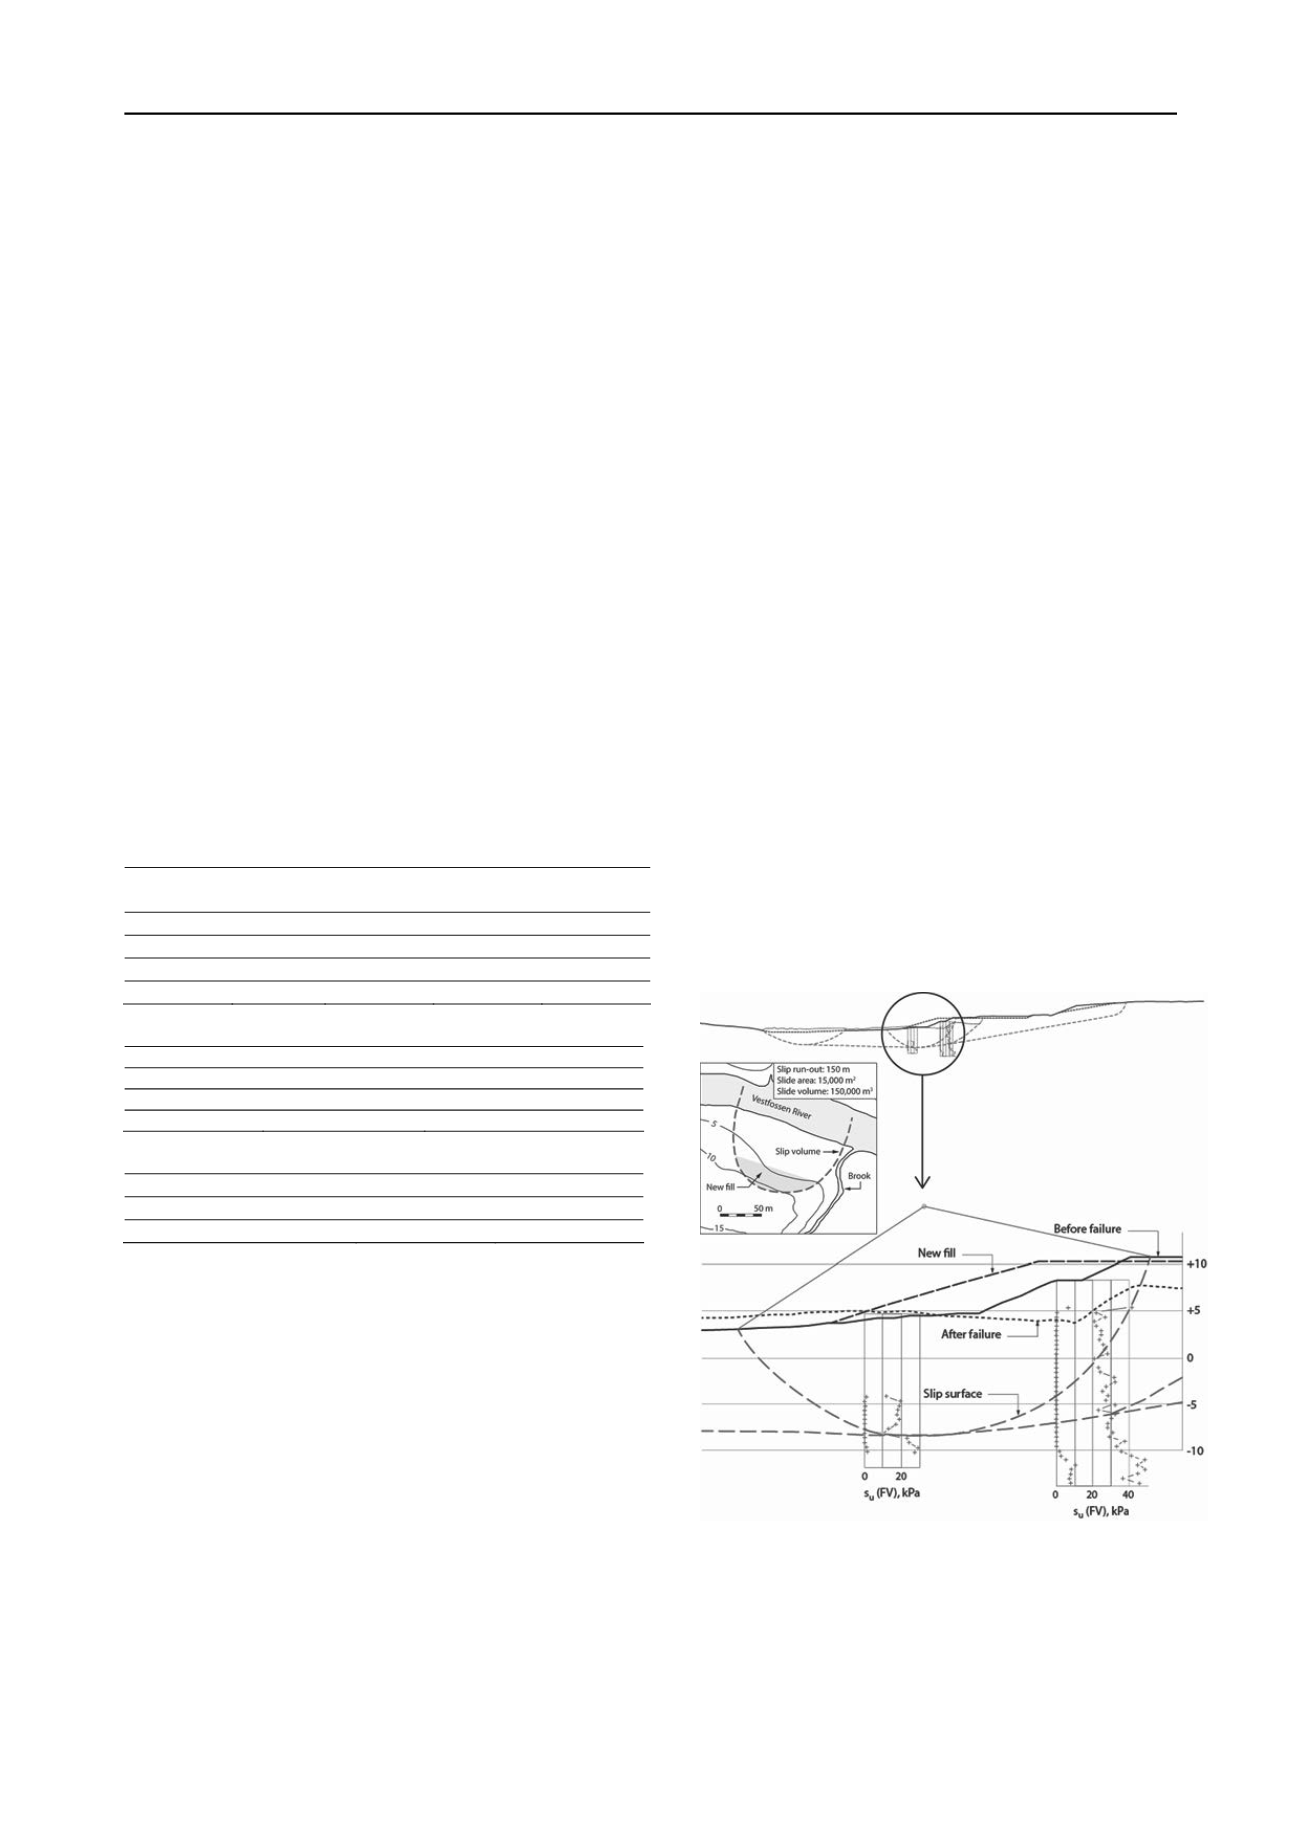
4 THE VESTFOSSEN SLIDE
4.1
Description of the landslide
The slide occurred in 1984 and involved 50,000 m
3
of soil that
propagated about 100 m in almost horizontal terrain until it
stopped on the opposite side of the Vestfossen River, close to
Drammen in Norway. The geometry before and after failure in
Figure 1 shows the critical circular slip surface in the middle
and other slip surfaces studies. The failure had a 150-m long
run-out across the Vestfossen River, as illustrated at the top of
Figure 1.
The failure was triggered by a fill placed mid-slope when a
new soccer stadium was to be built. During project planning, the
slope was probably assumed to have sufficient safety margin
because the new slope was not steeper than the original slope.
Figure 1. Cross-section before and after the Vestfossen slide also show-
ing the undrained shear strength from field vane tests.
4.2
Soil parameters
Below the drying crust, the clay had water content of 45% at
depths 4 to 10 m. The water content decreased to 30% below 12
m. Laboratory fall cone tests indicated a clay with extremely
high sensitivity with S
t
≈ 150-200 in the top 12 m, and S
t
≈ 50-


