19
Terzaghi Oration
/ Allocution Terzaghi
Proceedings of the 18
th
International Conference on Soil Mechanics and Geotechnical Engineering, Paris 2013
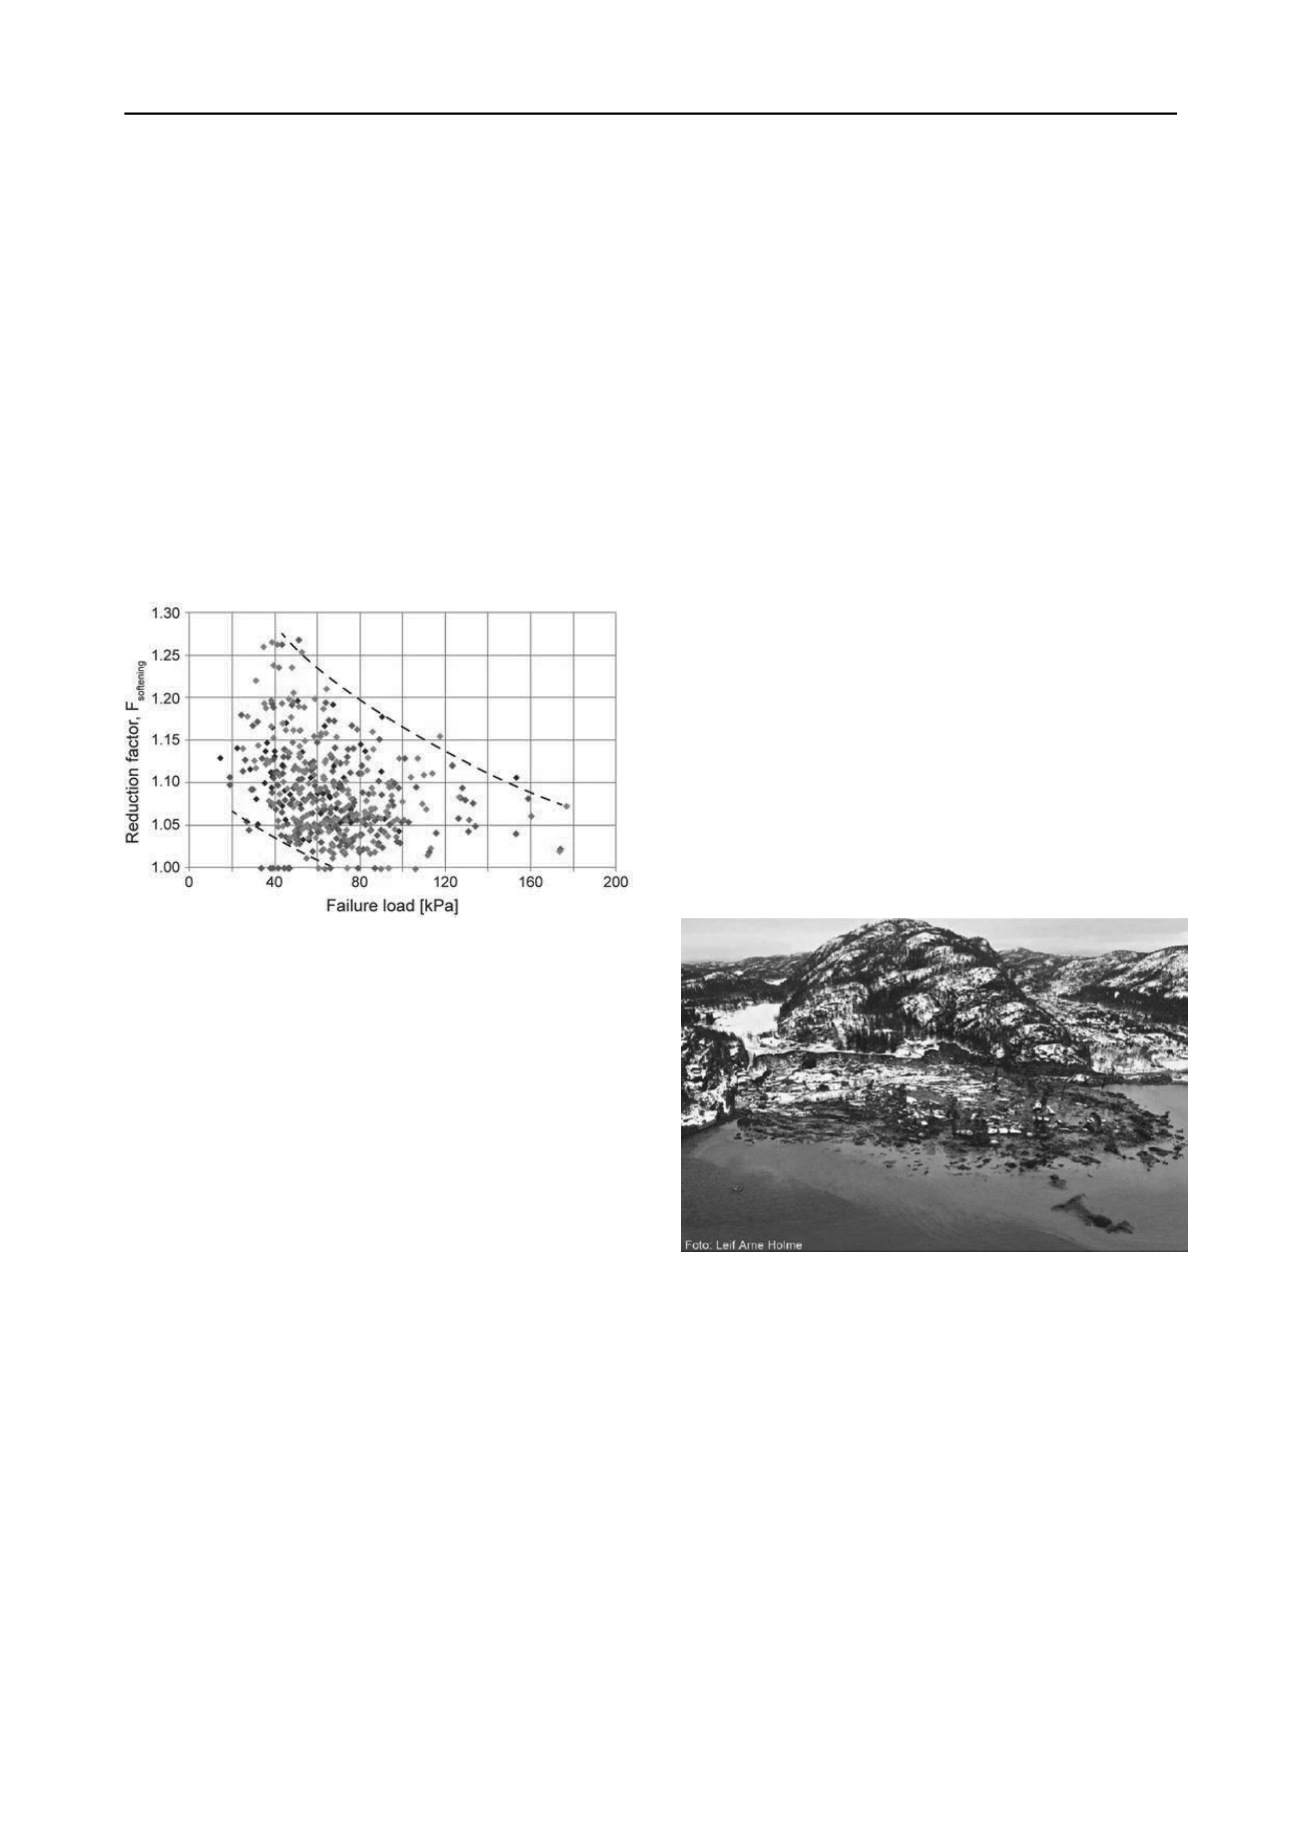
4.3.3
Sensitivity analyses
Jostad
et al
2013 did sensitivity analyses to quantify the re-
quired reduction in peak undrained shear strength, F
softening
, for
sensitive clays. Figure 9 illustrates the results obtained. The
analyses were done with the PLAXIS finite element code with
the NGI ADPSoft model. A total of 500 Monte Carlo simula-
tions were done.
The average required reduction of the peak undrained shear
strength in triaxial compression, direct simple shear and triaxial
extension was 9% (F
softening
= 1.09). The values of F
softening
ranged between 1.02 and 1.27. Although Figure 9 shows scatter,
the effect of softening increases with decreasing load. The val-
ues of F
softening
of 1.0 were cases where failure occurred in the
drying crust. For 2.5 % of the simulations, F
softening
was greater
than 1.2, and for 12% of the simulations, F
softening
was greater
than 1.15. For stronger strain-softening clays, the factor F
softening
was considerably lower that for the softer clays with low failure
load.
Figure 9. Required reduction in peak undrained shear strength (F
softening
)
vs
failure load for all sensitivity analyses (Jostad
et al
2013).
4.4
Lessons learned
For brittle materials such as highly sensitive and quick clays,
the strain-softening behaviour needs to be taken into account in
the stability analyses (Jostad
et al.
2013; Fornes and Jostad
2013). The brittle nature of the failure and the strain-softening
are such that the peak strength measured in the laboratory can-
not be used directly in limit equilibrium analyses.
The stability of long slip surfaces in brittle and sensitive soils
cannot be calculated by classical limit equilibrium methods. The
calculated material coefficient will be overestimated for long
slip surfaces to a greater degree than for local slip surfaces.
Failure on long slip surfaces generally develops progressively in
time and space. The shear strength along part of the slip surface
reduces significantly, moving towards the remoulded shear
strength, while other parts are still in the pre-peak, hardening
regime. The peak shear strength is not representative for the
shear resistance along the potential slip surfaces.
Stability calculations in practice are usually done by limit
equilibrium approaches that account for horizontal, vertical and
moment equilibrium. As no commercial software that fully ac-
counts for progressive failure is available today, limit equilib-
rium methods will continue to be used in practice.
In the case of Vestfossen, one should note that it was neces-
sary to reduce the peak shear strength by an average of 10%, if
limit equilibrium analysis was used. The reduction accounts in-
directly for strain compatibility and time effects.
The initiation and progressive failure were captured well by
a large deformation finite element analysis with PLAXIS 2D
(Grimstad and Jostad 2011), using the NGI-ADPSoft material
model: the safety factor was then 1.0.
One needs to establish a reduction in the peak shear strength
required to account for the strain-softening in limit equilibrium
analyses. One can either apply a reduction factor on the peak
undrained shear strength from triaxial compression, direct sim-
ple shear and triaxial extension tests, or one can apply different
factors on each test type, e.g. 15% on the triaxial compression
strength, 10% on the direct simple shear strength and 5% on the
triaxial extension strength. Based on Figure 9, one should con-
sider establishing a reduction factor as a function of clay type
(or strength), type of slip surface and perhaps slope inclination
and clay sensitivity. With the knowledge available today, an av-
erage reduction factor between 1.10 and 1.15 may be reason-
able. More research on this topic is underway.
5 LANDSLIDE IN KATTMARKA
5.1
Description of the landslide
On March 13 2009, about midday, in Kattmarka near Namsos
north of Trondheim in Norway, a slide occurred, moving about
500.000 m
3
of material in a scar measured afterwards of about
100 m width by 300 m length. The slide destroyed a highway
and damaged four permanent dwellings and 6 summer resi-
dences. Seven persons, who had been transported on the slide,
were rescued unharmed by helicopter. Figures 10 and 11 illus-
trate the slide that occurred. Figure 12 illustrates the sequence
of the movements (from 1 to 5) based on observations and eye-
witness accounts. The slide (part in Fig. 12) started about ½
minute after the blasting of rock as part of highway construction
nearly (Fig. 12). Part 2 slid 2 minutes later, thereafter Parts 3, 4,
and 5. The sliding activity lasted between 6 and 10 minutes. The
construction project nearby was a widening of the road into the
mountainside, adding sidewalks, and upgrading of sewers and
pavement by the Norwegian Public Road Administration.
Figure 10. Photograph of Kattmarka landslide (photo: L.A. Holme).
5.2
Soil parameters
The soil investigations post-landslide revealed the presence of
sensitive clay with lenses of silt and sand. The clay thickness
was between 10 and 20 m above bedrock. There is a thin layer
of moraine above the bedrock. The soil consists of clay layers,
some more silty than others, with thin sand lenses at irregular
intervals. More than half of the clay was quick clay. The water
content was above the liquid limit. The overconsolidation ratio
in the clay below a drying crust about 2.5 m thick decreased
from 2.5 at a depth of 3 m to 1.5 at a depth of 14 m.
Figure 13 presents the undrained shear strength profile for
the area. On the basis of the test results, the undrained shear
strength selected for the stability analyses was selected as:
s
u
C
= 15
(kPa)
+ 2.0
(kPa/m)
· z
(m)
(1)
where s
u
C
is the undrained shear strength in triaxial compression
and z is the depth in meters. The undrained shear strength was


