18
Proceedings of the 18
th
International Conference on Soil Mechanics and Geotechnical Engineering, Paris 2013
Proceedings of the 18
th
International Conference on Soil Mechanics and Geotechnical Engineering, Paris 2013
was too optimistic, because the peak shear strengths were used
and side shear was not included in the analyses.
4.3.2
Finite element analyses
The material model NGI-ADPSoft (Grimstad and Jostad 2012)
was used to model the sensitive clay. The model is a user-
defined special version of the NGI-ADP model (Grimstad
et al
2010; 2011) which was implemented as a standard material
model into Plaxis
). The model is an elasto-
plastic model that describes the anisotropic behaviour of clays
during undrained shear and includes post peak strain-softening.
The model is suitable for modelling the initiation of progressive
failure in sensitive clays under undrained loading.
The model uses as input the data from anisotropically con-
solidated undrained triaxial compression (CAUC) tests, constant
volume direct simple shear (DSS) tests and undrained triaxial
extension (CAUE) tests. The input parameters are the peak
undrained shear strength s
up
and the residual shear strength s
ur
and the corresponding shear strains
p
and
r
along the shear
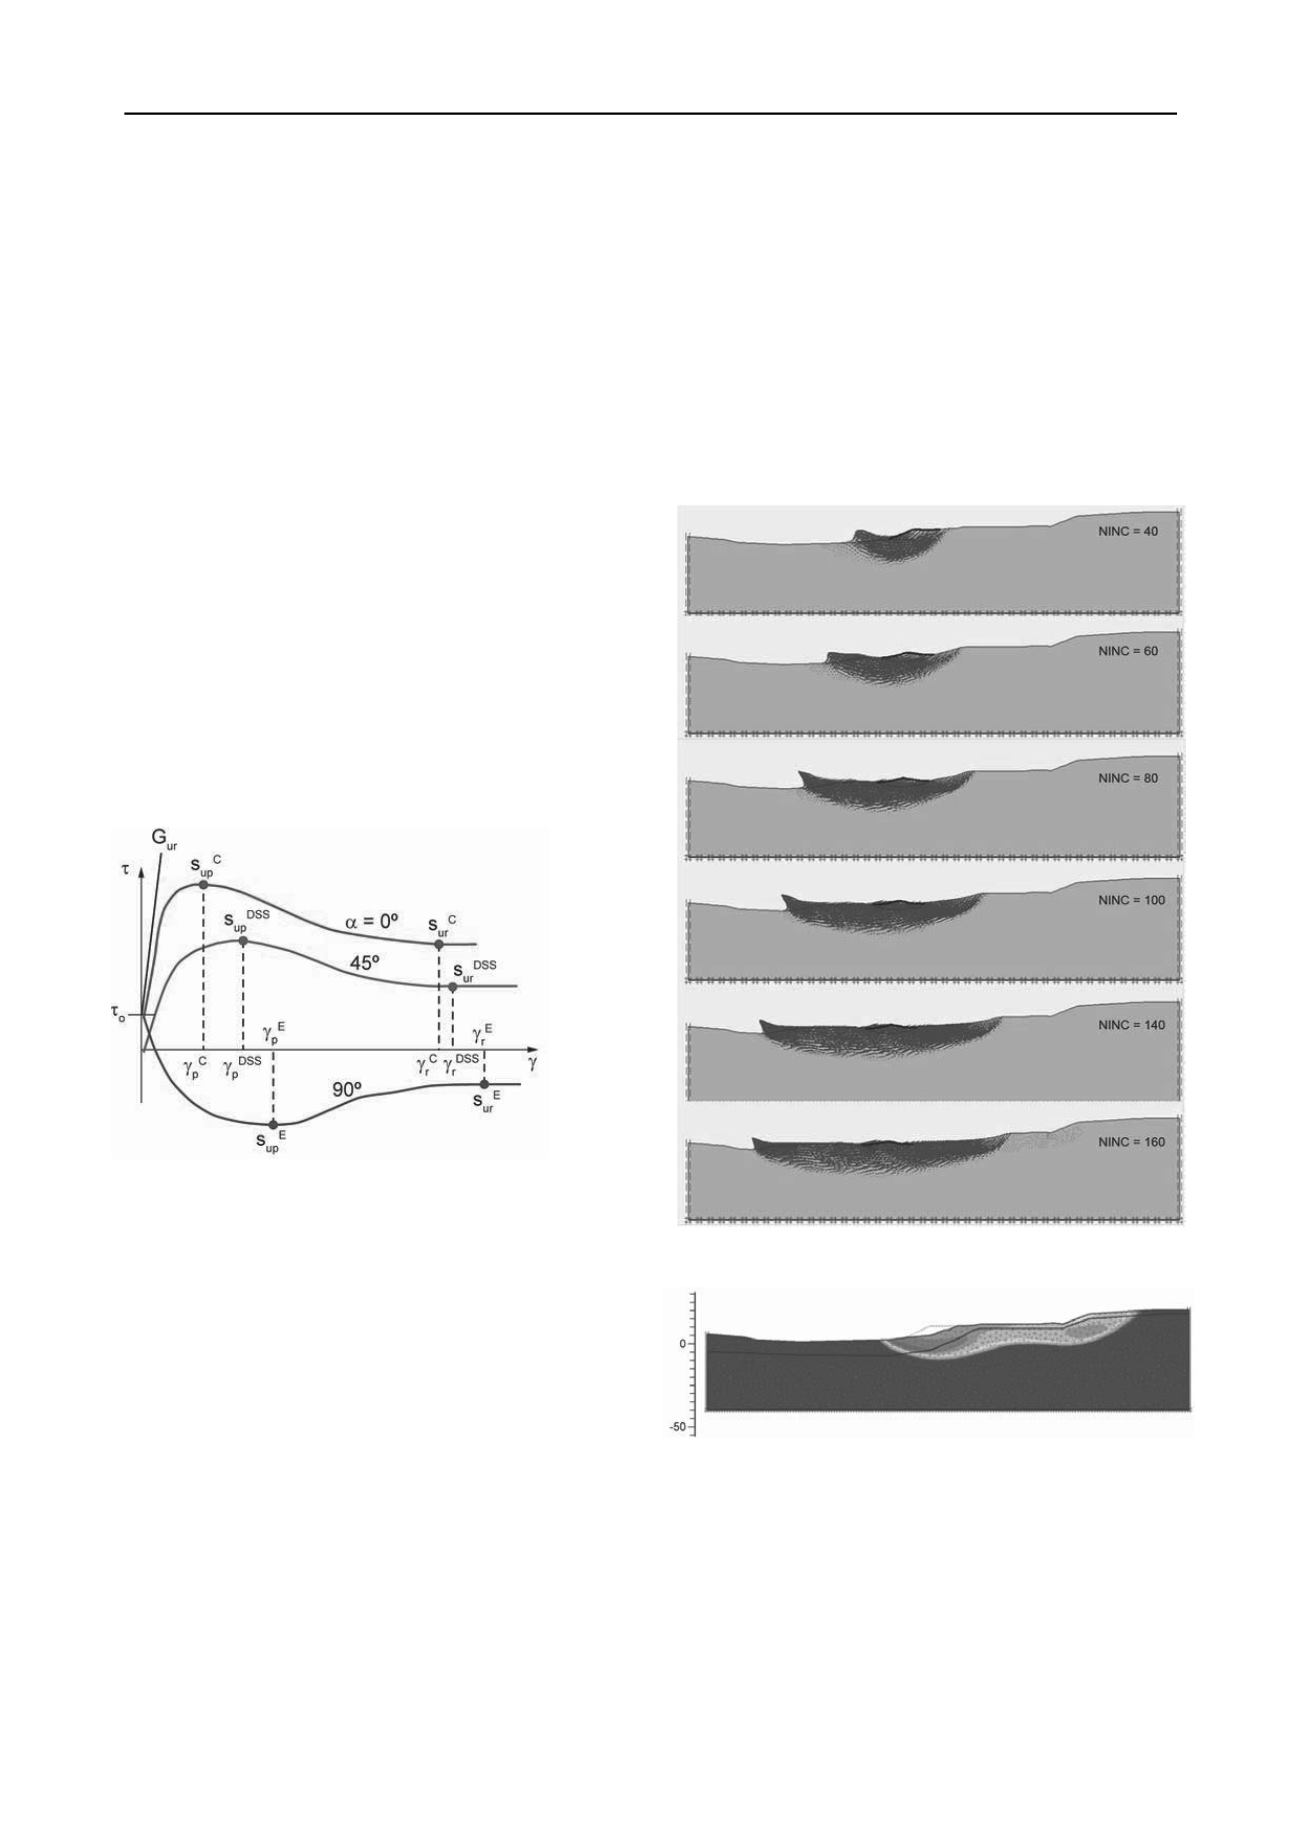
stress-shear strain curves (Fig. 6). The curves start at an initial
shear stress
o
with a slope equal to the initial shear modulus G
o
.
In the calculations, G
o
is set equal to G
ur
. Plane strain compres-
sion and extension were assumed to be equal to the results of
triaxial compression and extension tests.
Through interpolation between the three curves, the model
describes the general 3D anisotropic behaviour of the clay that
depends on the actual orientation of the maximum shear defor-
mation.
Figure 6. NGI-ADPSoft model parameters (Fornes and Jostad, 2013).
The softening behaviour is governed by introducing a “non-
local plastic shear strain”. The so-called “non-local strain” (Er-
ingen, 1981) means that the plastic strain in a stress point
(Gaussian integration point) is replaced by an integrated
weighted average plastic strain within a specified zone around
the point. The plastic strain and ensuing reduction in shear
strength during softening become mesh independent, and are
controlled by the input parameters. The shear band thickness
and resulting brittleness are then also controlled by the input
data (Grimstad and Jostad, 2011; Grimstad and Jostad 2012).
Figure 7 illustrates the progressive development of the fail-
ure. Each diagram gives a snapshot for increasing incremental
displacements (from NINC =40 to 160). The figure shows that it
is possible to model strain-softening. The analysis did not in-
clude the
in situ
variation in sensitivity of the quick clay (clay is
much less sensitive upstream), and without the complete effect
of the drying crust, which, if included, would have limited the
shearing at the toe (which is unrealistically large in Figure 7).
Jostad and Grimstad (2011) found that the critical strain at
which progressive failure starts to develop is low, and not large
enough to remould the clay. It is therefore only the initial part of
the strain-softening curve that is of interest for capacity. The
remaining part of the strain-softening curve towards residual
governs post-failure displacements.
The safety factor obtained by the finite element analysis be-
fore failure, without strain-softening and without strain com-
patibility was 1.28, which is very close to the 1.26 in Table 5.
With the addition of fill, the safety factor from the finite ele-
ment analyses was 1.0. Figure 8 illustrates the failure zone for
the case of no strain-softening. The failure zone extends much
further up slope and less at the toe than in the case with strain-
softening. The uncertainties in the analyses were mainly related
to the strength in the drying crust, the initial effective stresses
under the fill, and the thickness of the shear band after mobiliza-
tion has been initiated.
Figure 7. Incremental displacements in modell of Vestfossen progres-
sive failure
(NGI 2012).
Figure 8. Contours of total displacements, model without strain-
softening, scale in m (NGI 2012).
In summary, it was possible to obtain a factor of safety of 1
when using a best estimate of the soil parameters and the NGI-
ADPSoft model, but the stress-strain curves used in the analyses
had to account for the strain-softening observed in laboratory
tests. The finite element modelling of the deformation under the
embankment load led to a progressive development of the fail-
ure in a nearly horizontal terrain. The failure occurred along a
circular slip surface (as shown), which gradually progressed as a
circular surface towards the river. This was very close to the ob-
served displacements after the failure in 1984.


