17
Terzaghi Oration
/ Allocution Terzaghi
Proceedings of the 18
th
International Conference on Soil Mechanics and Geotechnical Engineering, Paris 2013
100 below 12 m. The overconsolidation ratio below the drying
crust was 1.1, due to aging) Figure 1 provides profiles of undis-
turbed and remoulded undrained shear strength from the field
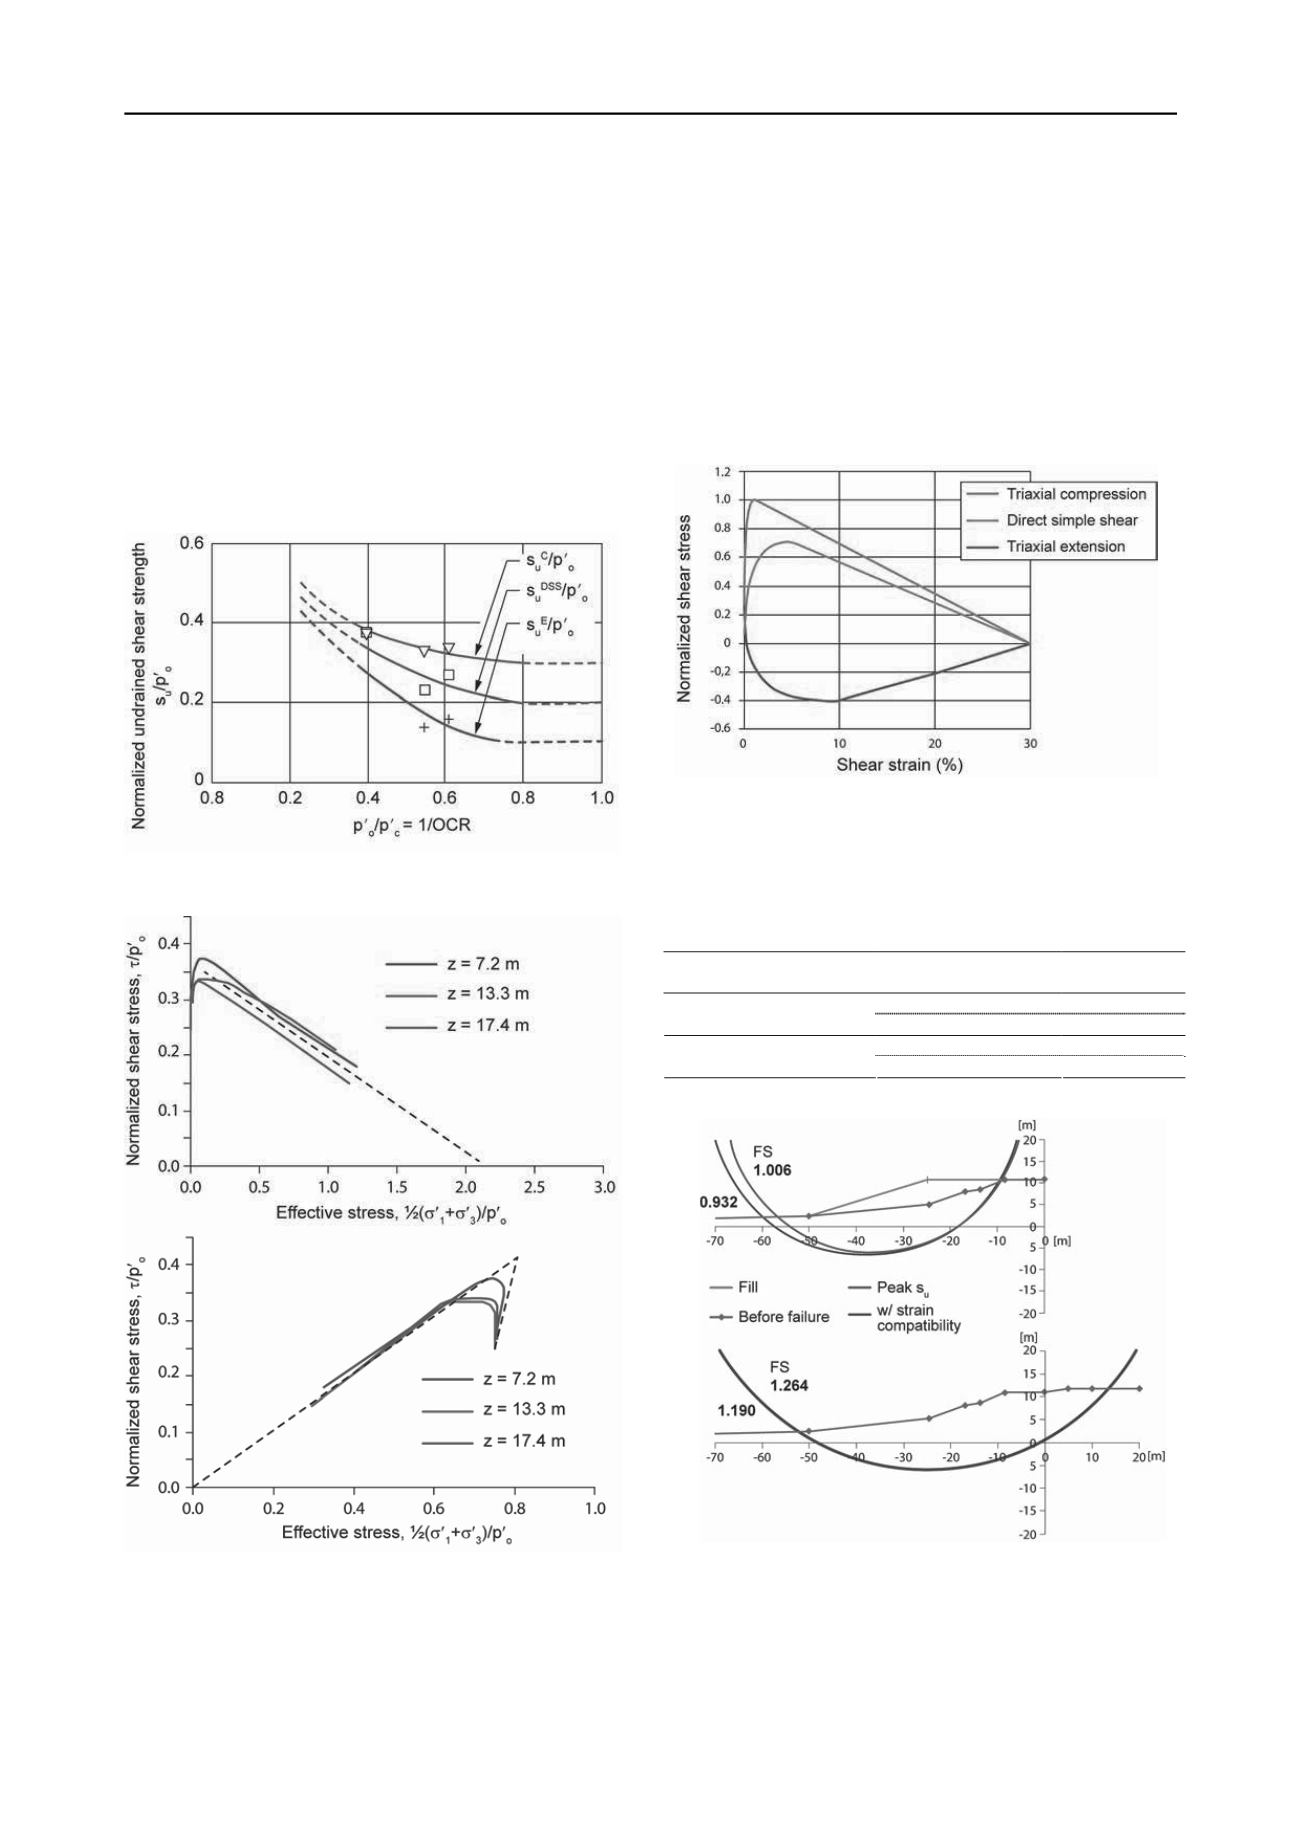
vane test (FV). Figure 2 presents the undrained shear strength
normalized with the effective overburden stress, p'
o
, from triax-
ial compression, direct simple shear and triaxial extension tests
vs
the inverse of the overconsolidation ratio (OCR). Specimens
from depths of 7, 13 and 17 m were tested. Figure 3 illustrates
three stress strain curves and effective stress paths from anisot-
ropically consolidated triaxial compression tests. The residual
shear strength and the peak shear strength for a “perfect” sample
are also indicated with the dashed line. To simulate a “perfect”
sample, the effective stress path of a perfect specimen follows
an angle of 1:3 up to the failure line (Berre
et al
2007).
Figure 2. Normalized undrained shear strength, Vestfossen clay (Grim-
stad and Jostad, 2011a).
Figure 3. Stress-strain curves and effective stress paths from triaxial
compression tests, Vestfossen clay (Grimstad and Jostad, 2011b).
4.3
Analyses of the slide
4.3.1
Limit equilibrium analyses
The classic Fellenius method was used, where the factor of
safety, FS, is calculated from the ratio of the sum of resisting to
the sum of driving forces. The calculations considered strain
compatibility (Grimstad and Jostad 2012). The strain compati-
bility was achieved by finding the highest safety factor on a
given slip surface for different constant shear deformations.
Thereafter, the slip surface giving the lowest safety factor was
located. The strain-compatible critical slip surface was not nec-
essarily the same as for the case without strain compatibility.
To do strain-compatible calculations, an idealized material
model was used, as shown in Figure 4. The peak shear stress
was taken at a shear strain of 1% in triaxial compression, 5% in
direct simple shear and 10% in triaxial extension.
Figure 4. Idealized anisotropic stress-strain model for strain-
compatibility modelling (Grimstad and Jostad 2012).
Figure 5 presents the results of the limit equilibrium stability
analyses when the peak undrained shear strengths were used.
The factors of safety obtained are listed in Table 5.
Table 5. Result of limiting equilibrium analyses of Vestfossen slide.
Case
(Slip surface)
Strain compatibility
Factor of
safety
No
1.01
Fill added
(Fig. 5, top)
Yes
0.93
No
1.26
Before addition of fill
(Fig. 5, bottom)
Yes
1.19
Figure 5. Result of limiting equilibrium analyses of Vestfossen slide
(Grimstad and Jostad 2012).
Including the strain compatibility criterion decreased the safety
factor by about 7%. With the strain-compatible model and the
added fill, the slip surface extended further beyond the toe. The
safety factor of 1.2 for the case “before the addition of the fill”


