362
Proceedings of the 18
th
International Conference on Soil Mechanics and Geotechnical Engineering, Paris 2013
Alkylsiloxane on the particle surface with molecular level. Then,
the mixture of sands and solution was oven-dried at 80
°
C.
2.2
Optical observation
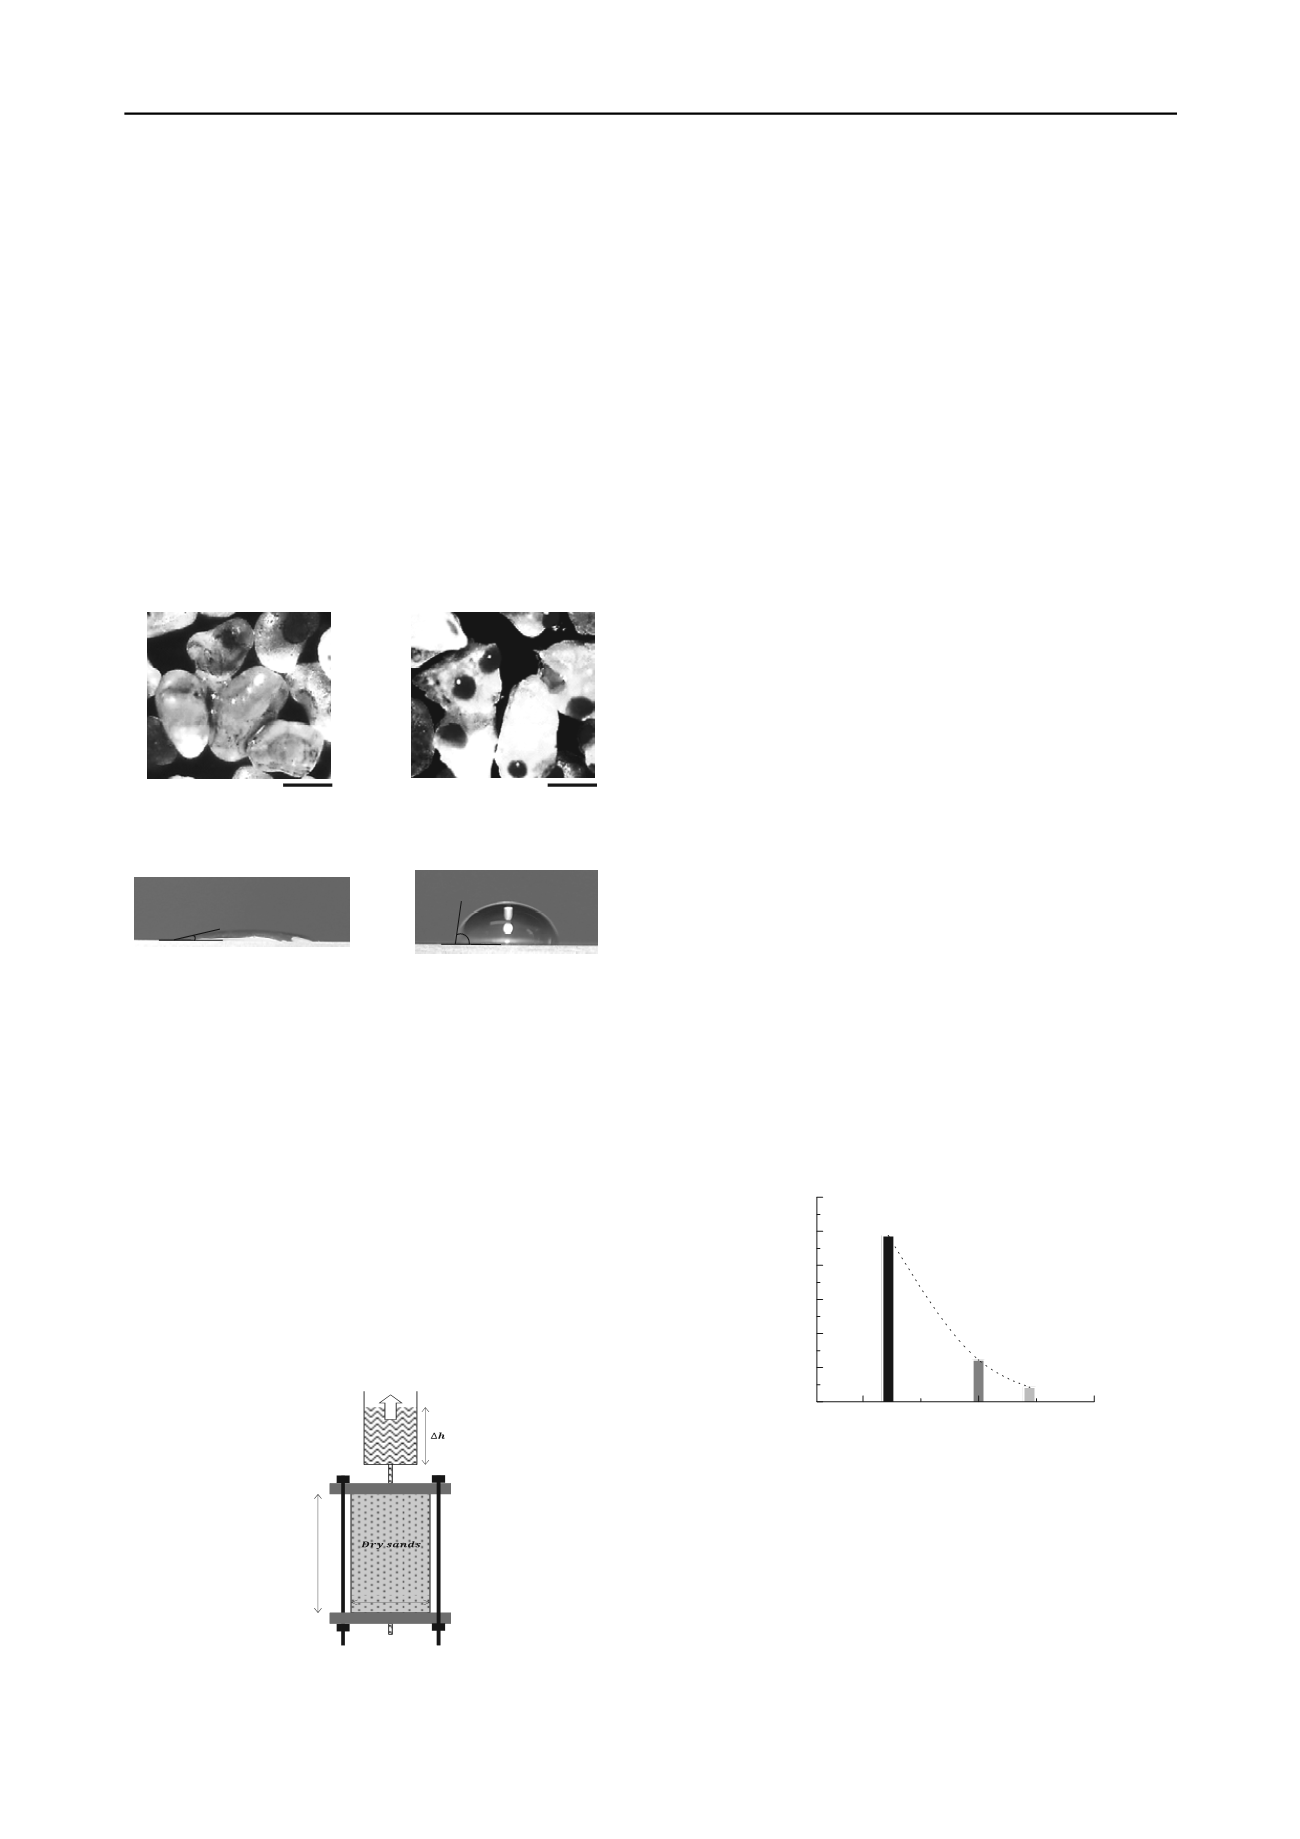
Water distribution in hydrophilic and hydrophobic sand was
observed by an optical microscope. Water exists mainly at the
inter-particle contacts whereas hydrophobic sand induces the
formation of water blobs on the surface attributed to the non-
wettability (Figure 1). In order to obtain the contact angle, the
glass slide was simultaneously treated with silane. Water
droplets were dropped both on the non-treated glass slide and
treated glass slide to observe the contact angle (
θ
) respectively
(Figures 1-c and 1-d). The contact angle of hydrophobic surface
is 85
o
which is more than six times higher than that of
hydrophilic sand.
Large contact angle indicates that the soil has large interfacial
tension between soil and water. Therefore meaning the soil
surface has high hydrophobicity.
0.5 mm
0.5 mm
(a) Spatial distribution of water
in the wettable sands
(b) Spatial distribution of water
in the non-wettable sands
(c) Contact angle on the wettable
surface (~13
°
)
(d) Contact angle on the non-
wettable surface (~85
°
)
Figure 1. Optical observations of water droplet formed on the weattable
and non-wettable samples in the micro scale.
2.3
Hydraulic properties
2.3.1
Critical hydrostatic pressure test
Water needs to overcome the capillary pressure in
hydrophobic sand so that the critical pressure exist over which
water begins permeating into pore space. The experiment was
conducted by using various particle sizes of non-wettable sands
(Ottawa 20-30, Jumunjin sands and Ottawa F110). Dry samples
seat in a cylinder with diameter 7 cm, height 15 cm. The water
pressure is increased gradationally by 1 mm interval, and the
height is measured when the water starts to permeate.
15cm
7cm
Figure 2. Experimental configuration of the critical hydrostatic
pressures of non-wettable sands.
Figure 2 show the experimental configuration. The test was
repeated three times for each specimen.
2.3.2
Hydraulic conductivity test
Although it is evident that the hydrophobic sand tends to repel
water phase at unsaturated condition, caused by the modified
surface wettability, the assessment of hydraulic conductivity at
fully saturated condition is still required. Both hydrophilic and
hydrophobic sands are subjected to constant head testing to
obtain hydraulic conductivity values. The hydrophobic sands
are forced for thoroughly mixing with water to attain 100%
degree of saturation. The 147cm of head is maintained to the
cell with the diameter of 15 cm and height 50 cm. The drained
water was collected for 3 minutes and measured the weight
2.4
Compression test
A series of the direct shear tests were carried out under a
constant pressure condition. The soil sample used was Jumunjin
sand. The circular specimen is 60 mm in diameter and 20 mm in
height, and has the relative density of about 75% for the
maximum dry density. In case of a natural dried condition, the
sand specimens were prepared by the air pluviation method. The
vertical stresses of 20, 50, 80 kPa in the consolidation process
were loaded. On the other hand, the sand specimens according
to the degree of saturation under the unsaturated condition were
prepared by the static compaction method. The vertical stress of
50 kPa in the consolidation process was loaded. The opening of
0.2 mm between the lower and upper shear boxes was set. The
shearing rates of the natural dried condition and the unsaturated
condition were 3.3x10
-4
mm/sec and 3.3x10
-5
mm/sec,
respectively.
3 RESULT AND DISSCUSSION
3.1
Hydraulic properties
The critical pressure sharply increases as the particle size
decreases (e.g., the corresponding size of pore throat should
decrease) in Figure 3. The denial of water permeation acts as a
hydraulic barrier for a given critical pressure while it may cause
the surface erosion. Once the water begins permeating, the
preferential flow is predominant by forming fingering. The
evolution of critical pressure follows the reciprocal relationship
between capillary pressure and pore radius defined in Young’s
equation.
0.0
0.5
1.0
0
1000
2000
3000
4000
5000
6000
Ottawa sand 20-30
421.69 [Pa]
Jumunjin sand
1222.56 [Pa]
Threshold pressure [pa]
Mean particle Diameter [mm]
Ottawa sand F110
4867.37 [Pa]
Figure 3. Critical hydrostatic pressures of non-wettable sands
The estimated hydraulic conductivity values increases with
porosity whereas there is no noticeable difference between two
specimens. It may be attributed that the surface modification by
organic materials may not reduce the drag force in hydrophobic
sands. It is noted that the feasibility of 100% saturation for
hydrophobic sand is quite low so that the gathered hydraulic
conductivity delineates the upper bound.


