363
Technical Committee 101 - Session II /
Comité technique 101 - Session II
0.3
0.4
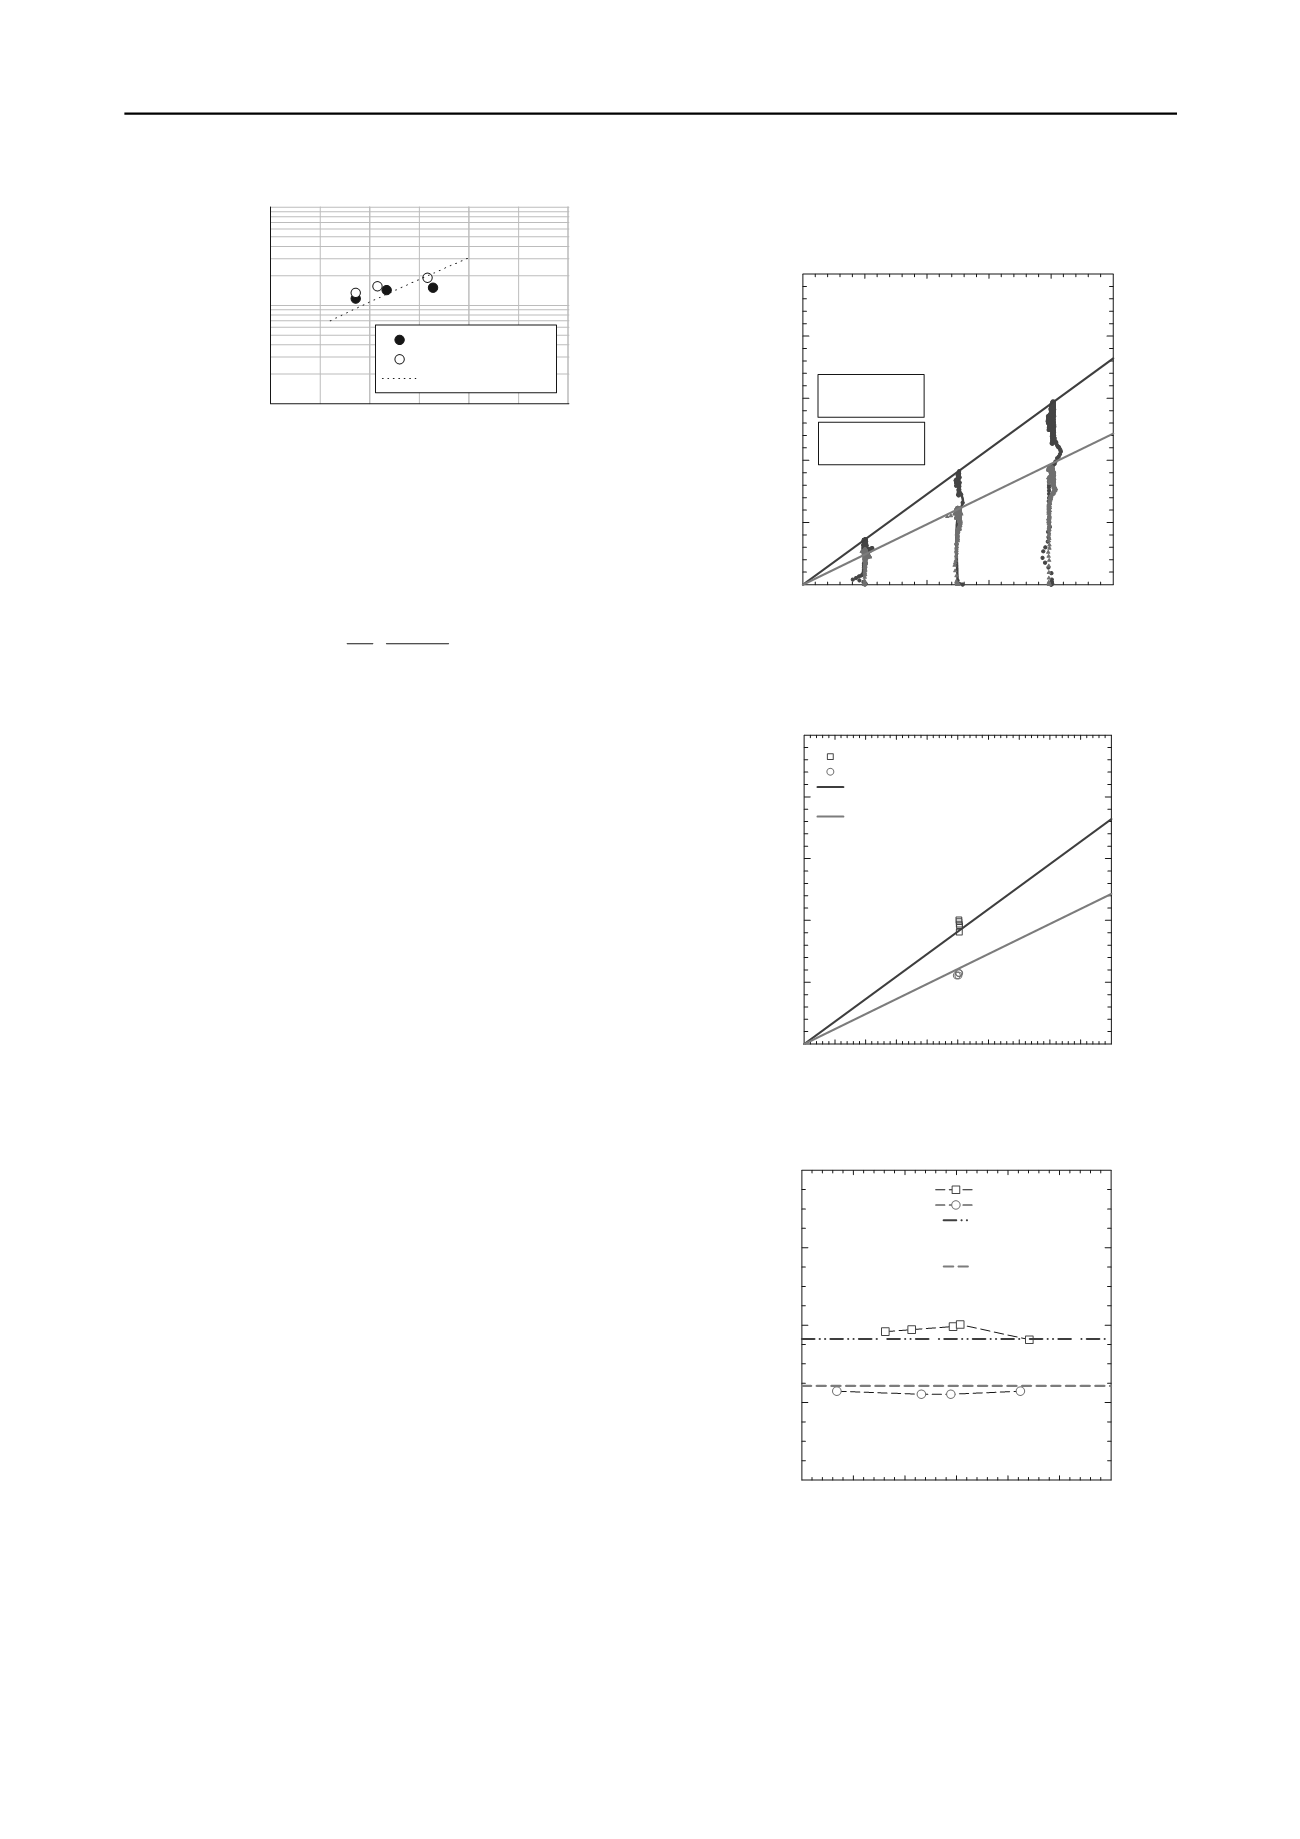
0.5
0.6
0.001
0.010
0.100
Wettable sample
Non-wettable sample
Kozeny-Carman
Hydraulic conductivity [cm/s]
Porosity
Figure 4. Hydraulic conductivity varied with porosity of wettable and
non-wettable sands.
The dotted line in Figure 3 is made based on the Kozeny-
Carman equation (Bear, 1972; Carman, 1956)
3
2
(1 )
g n
k
n
(1)
where
is the density of water,
g
is gravitational acceleration,
and
is the viscosity. The estimated value obtained by
Kozeny-Carman equation show similar range and aspect to the
values from the experiment, confirming validity of the
experiment.
Wettable samples tend to adsorb water on the surface due to
relatively strong capillary effect. On the other hand, non-
wettable samples which have relatively low surface free energy,
have characteristics that exclude water. So that the water flow at
the interface between the particles is affected by the repellency
of capillary pressure. It allows predicting faster fluid flow in
non-wettable sands than the fluid flow in wettable Jumunjin
sand. Results show that the hydraulic conductivity values of
both soils run with nominal difference, which highlights that the
wettability effect at particle scale seems negligible for fluid
flow at pore scale.
3.2
Geomechanical properties
From the results of a series of the direct shear tests using the
jumunjin sand under the natural dried condition, the cohesion
and the angle of internal friction for the hydrophilic and
hydrophobic sands were c=0,
φ
=36.1
°
, and c=0,
φ
=27.9
°
,
respectively as shown in Figure. 5. The difference in friction
angle is attributed to the surface modification grafted by organic
component. The existence of silane on particle surface serves as
lubricant to reduce the friction angle.
Figure 6 shows the comparison of the shear strength due to
the suction between the hydrophilic and hydrophobic sands. The
formation of meniscus inducing the suction pressure increases
the shear strength of hydrophilic sand while the hydrophobic
sand imposes less defined meniscus at the inter-particle which
causes the quasi-constant value of strength regardless of
saturation. It emphasizes the role of suction in hydrophilic sands
on the geomechanical properties. This tendency can be
obviously observed through the comparison of the maximum
shear stresses between the hydrophilic and hydrophobic sands
with varying degree of saturation in Figure. 7.
In case of the hydrophobic sand, the maximum shear stress
at varying degree of saturation follows the value at dry
condition without significant deviation. On the other hand, the
maximum shear stress of hydrophilic sand is captured at ~ 50%
degree of saturation. Note that the previous research on the
evolution of maximum shear stiffness (G
max
) is attained at ~
5~10% degree of saturation (Byun et al., 2011). Although the
negative capillary pressure should increase with decreasing
degree of saturation, the different strain regime between the
small-strain stiffness and large-strain strength may result in the
different peak saturation.
Vertical stress,
v
(kPa)
0
20
40
60
80
100
Shear stress,
(kPa)
0
20
40
60
80
100
Direct shear test
* Natural dried condition
* D= 60mm, H =20 mm
* Opening: 0.2 mm
* Shear rate: 3.3x10
-4
mm/sec
Hydrophilic Sand
c=0,
= 36.1
o
Hydrophobic Sand
c=0,
= 27.9
o
Hydrophilic Sand
Hydrophobic Sand
Figure 5. The relationship between vertical stress and shear stress under
the natural dried condition.
Vertical stress,
v
(kPa)
0 10 20 30 40 50 60 70 80 90 100
Maximum shear stress,
max
(kPa)
0
20
40
60
80
100
Hydrophilic Sand
Hydrophobic Sand
Natural dried condition
Hydrophilic Sand: c=0,
=36.1
o
Natural dried condition
Hydrophobic Sand: c=0,
=27.9
o
Hydrophilic Sand
Hydrophobic Sand
Figure 6. Comparison of the shear strength due to the suction between
the hydrophilic and hydrophobic sands.
Initial degree of saturation, S
r0
(%)
20 30 40 50 60 70 80
Maximum shear stress,
max
(kPa)
0
20
40
60
80
Hydrophilic Sand
Hydrophobic Sand
Natural dried condition
Hydrophilic Sand:
v
=50kPa,
=36.4kPa
Natural dried condition
Hydrophobic Sand:
v
=50kPa,
=24.3kPa
Figure 7. Variation of the maximum shear stresses between the
hydrophilic and hydrophobic sands according to the initial degree of
saturation.
4 CONCLUSIONS
Soils in geotechnical engineering have been regarded as the
wettable condition while the non-wettable soils prevail in nature.


