354
Proceedings of the 18
th
International Conference on Soil Mechanics and Geotechnical Engineering, Paris 2013
=
1
−
3
1
−
3
≤ 1.0
(3)
Where (
σ
1
-
σ
3
)
f
= the deviatoric stress at failure.
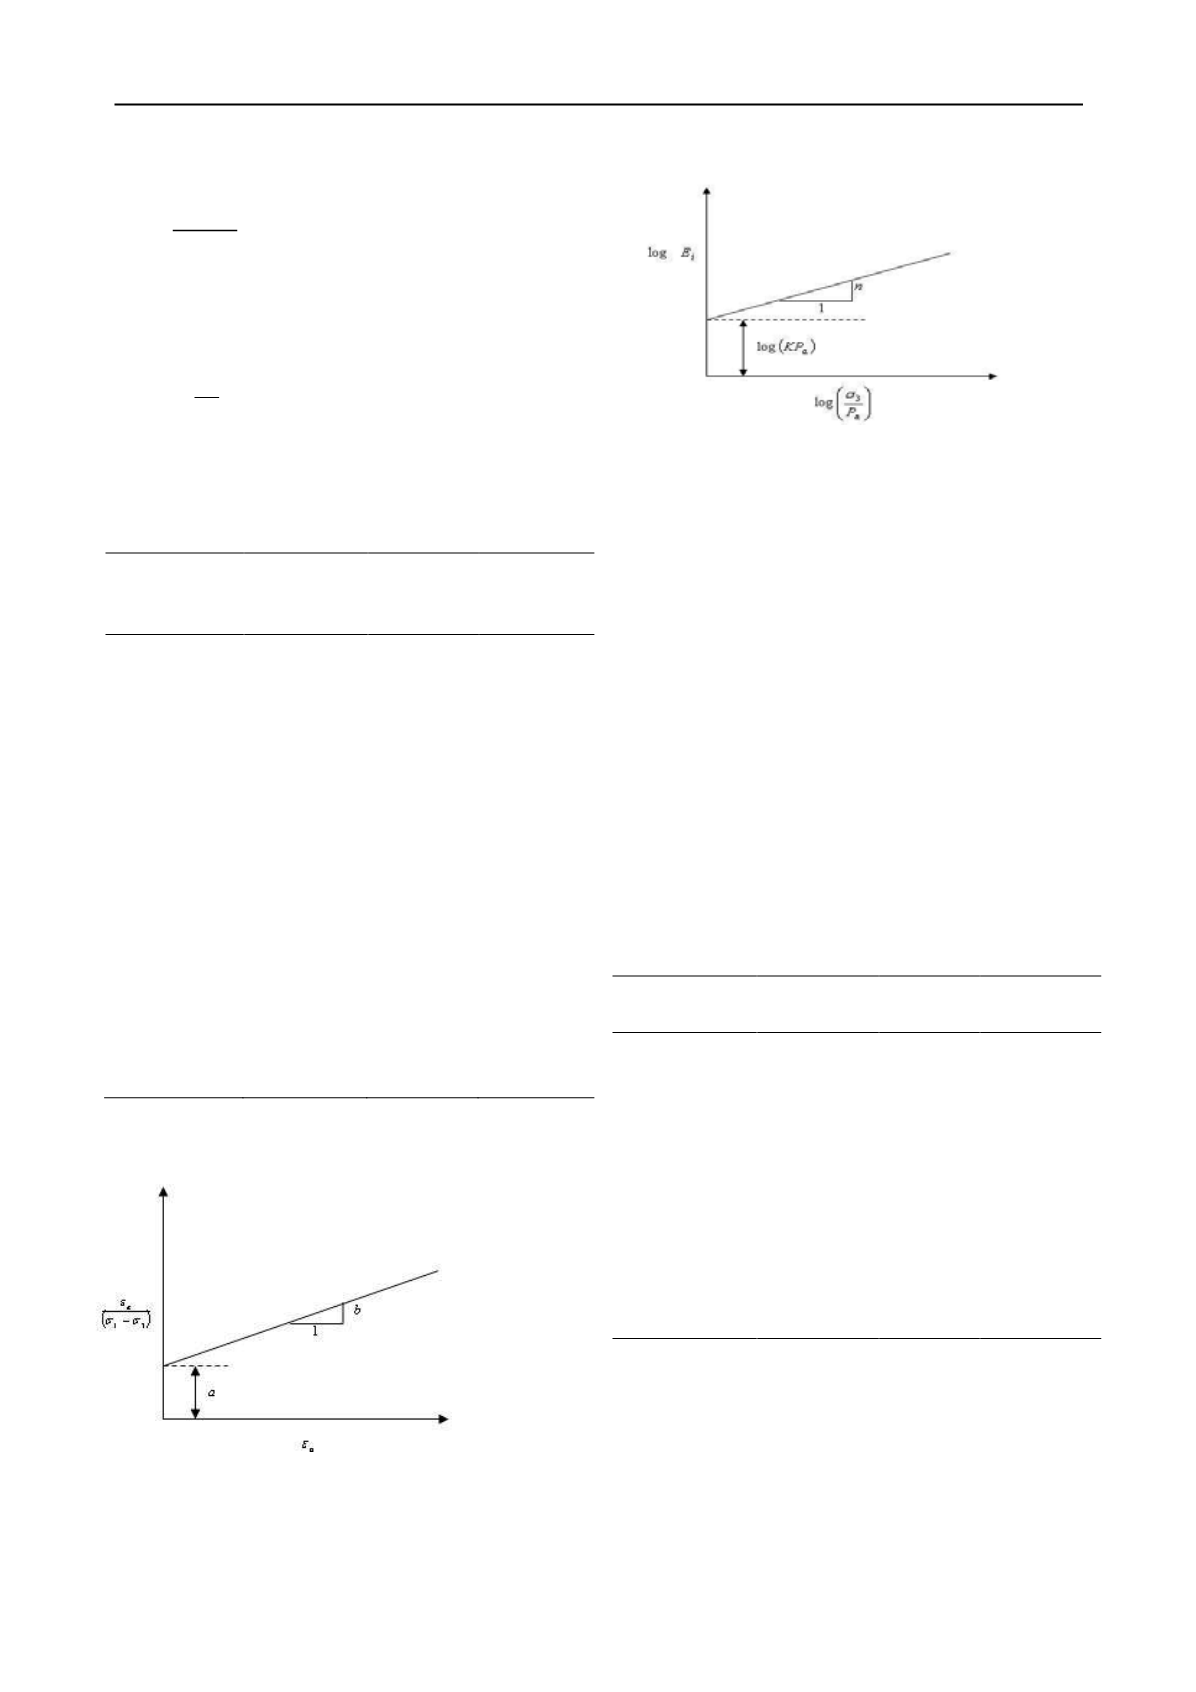
The following relationship for the initial modulus of
elasticity for soils is suggested (Janbu 1963):
n
a
a
i
P
kP E
=
3
σ
(4)
Where, n represents the exponential effect of
σ
3
on E
i
. K and n
can be determined by drawing a line fitted to data of the triaxial
tests, as presented in Figure 2.
Table 1. Mechanical properties of three rockfill materials
Rockfill Type
Australia
Railway
Ballast
Roodbar
Dam
Material
Yamchi
Dam
Material
Mineralogy
Latite
basalt
Lime
stone
Andesite
D
min
(mm)
20
0.15
0.072
D
max
(mm)
65
50.8
74.3
C
u
1.5
23
65.4
σ
3
(kPa)
90
120
240
500
700
900
200
400
700
φ
°
54.6
52
45.8
30.6
38.7
B
g
*
(%)
10
11
12
13.5
NIA
**
Shape
Highly Angular
Angular/ sub
Angular
Rounded
* *
NIA: No Information Available
*
B
g
: Marsal’s breakage index
Figure 1. Determining constants a and b from a triaxial test results
Figure 2. Determining constants n and K from three triaxial tests results
3.2.
Application of the model
In this section, the mechanical behavior of the thirty rockfill
materials, which the characteristics of three types of them are
presented in Table 1, are investigated analytically in the
framework of the Hyperbolic Model. Values of parameters n
and K for the materials introduced in Table 1, for every two
consecutive triaxial tests, and furthermore, for three triaxial
tests, are extracted and presented in Table 2. Therefore, for each
of the materials three values of n are calculated; one from the
first and second triaxial tests results, one from the second and
third triaxial tests results, and one from first, second and third
triaxial tests. We intentionally calculated the first two values for
n to highlight the effect of particle breakage on E
i
(through n)
with every increase of
σ
3
. This is different from the similar
procedure of determining n for soils, where usually a unique n
value can be extracted from results of triaxial tests with three
consecutive confining stresses (
σ
3
) on a given material. The
details of determining n and K from the triaxial tests results are
given in Duncan and Chang 1970.
Table 2. Values of n and K parameters for the rockfill materials
introduced in Table 1
Rockfill Type
(
σ
3
)
1
, (
σ
3
)
2
(kPa)
n
K
Australia
Railway Ballast
90, 120
-7.45
3500
120, 240
-0.95
1070
90,120 ,240
-3.32
2100
Roodbar Dam
Material
500, 700
-6.53
18×10
8
700, 900
-1.15
52000
500,700, 900
-3.26
10×10
5
Yamchi Dam
Material
200, 400
2.7
1180
400 , 700
0
5×10
4
200,400, 700
1.5
3000
Table 3 compares the average values of n for the relatively
rounded and relatively angular rockfill materials of this study
separately, with typical values for loose and dense sands. As
expected, the average n for the rockfill materials are far less
than that of the typical dense sand; moreover, n reduces with
increasing of the materials' angularity. It should be mentioned
that highly angular, angular, angular/sub angular and sub
angular materials are assumed as relatively angular materials;
while, rounded, rounded/sub rounded and sub rounded ones are
assumed as relatively rounded materials.


