350
Proceedings of the 18
th
International Conference on Soil Mechanics and Geotechnical Engineering, Paris 2013
Proceedings of the 18
th
International Conference on Soil Mechanics and Geotechnical Engineering, Paris 2013
2.3
Soils
The paper deals with 4 sets of density tests. The means (
x
) and
the standard deviations (
) of the variables
s
min
,
s
max
and
s
min
/
s
max
and
e
min
,
e
max
and
e
min
/ e
max
were determined.
In the program of Kabai (1968 to 1974, Group I) 33 grading
curve series (
artificial mixtures made of natural soil grains of
the Danube sands
) were defined in terms of the coefficient of
uniformity C
U,
and the grainsize parameters
d
max
,
d
10
. The
grading curves can be seen in Imre et al (2009). The minimum
and maximum dry density were determined. The results can be
seen in Table 1.
The calibration chamber sand database (Group II, Lunne et
al (1992), Mayne and Kulhawy (1992)) consists of 25 sands. It
can be assumed that the minimum and maximum dry density
tests were made by various methods, including the ASTM
Standards (i.e. D 4253 Standard Test Methods for Maximum
Index Density and Unit Weight of Soils Using a Vibratory
Table and D 4254 Standard Test Methods for Minimum Index
Density and Unit Weight of Soils) and the German Standard
(i.e. DIN 18126 for the maximum and minimum dry density).
The results are shown in the Table 2.
In the ongoing testing program two additional data sets were
produced with the German DIN (Groups III and IV) using 24
Danube
sands 182 German sands, respectively.
In Group III
some
Danube sands
were used, the composition can be seen in
Imre et al (2011). in Group IV some German commercial sands
were used. the composition can be seen in Szalkai (2012). The
results are shown in the Tables 3 and 4.
The artificial mixtures
were made of soil grains with
7 fractions of a diameter range of
d
min
= 0.06 mm and
d
max
= 8 mm.
Concerning the data of
Lőrincz
(1986), some
artificial
mixtures of mold sand grains
) were defined in terms of grading
entropy for various purposes, to elaborate some particle
migration criteria and filtering law, to test the existing filtering
laws, some grading curves can be seen e.g. in Imre et al (2009).
Only the minimum dry density was determined using the
Proctor mold. Some fractions results can be seen in Figure 2
showing that
dry density
of the sand fractions are increasing
with grain diameter.
2.4
Statistical tests
The means (
x
) and the standard deviations (
) of the variables
s
min
,
s
max
and
s
min
/ s
max
for any two groups of data were
compared using the standard parametric statistical tests (see e.g.
in Rétháti, 1988).
The
F
-test was used to evaluate the null hypothesis that two
data sets with normal distribution have the same variance. The
Welch test and
t
tests were used to test the null hypothesis that
two data sets with normal distribution have the same means
with the data having possibly unequal and equal variances,
respectively.
The Pearson correlation
R
is obtained by dividing the
covariance of the two variables by the product of their standard
deviations. The Pearson correlation is +1 in the case of a perfect
positive (increasing) linear relationship (correlation) and,
−1 in
the case of a perfect decreasing (negative) linear relationship
since the following relationship is met:
b ax y
yxR
1 ) ,(
(
3
)
The Pearson correlation is some value between
−1 and 1 in all
other cases, indicating the degree of linear dependence between
the variables. As the Pearson correlation
R
approaches zero
there is less of a linear relationship. The closer the coefficient is
to either
−1 or 1, the stronger the linear correlation between the
variables.
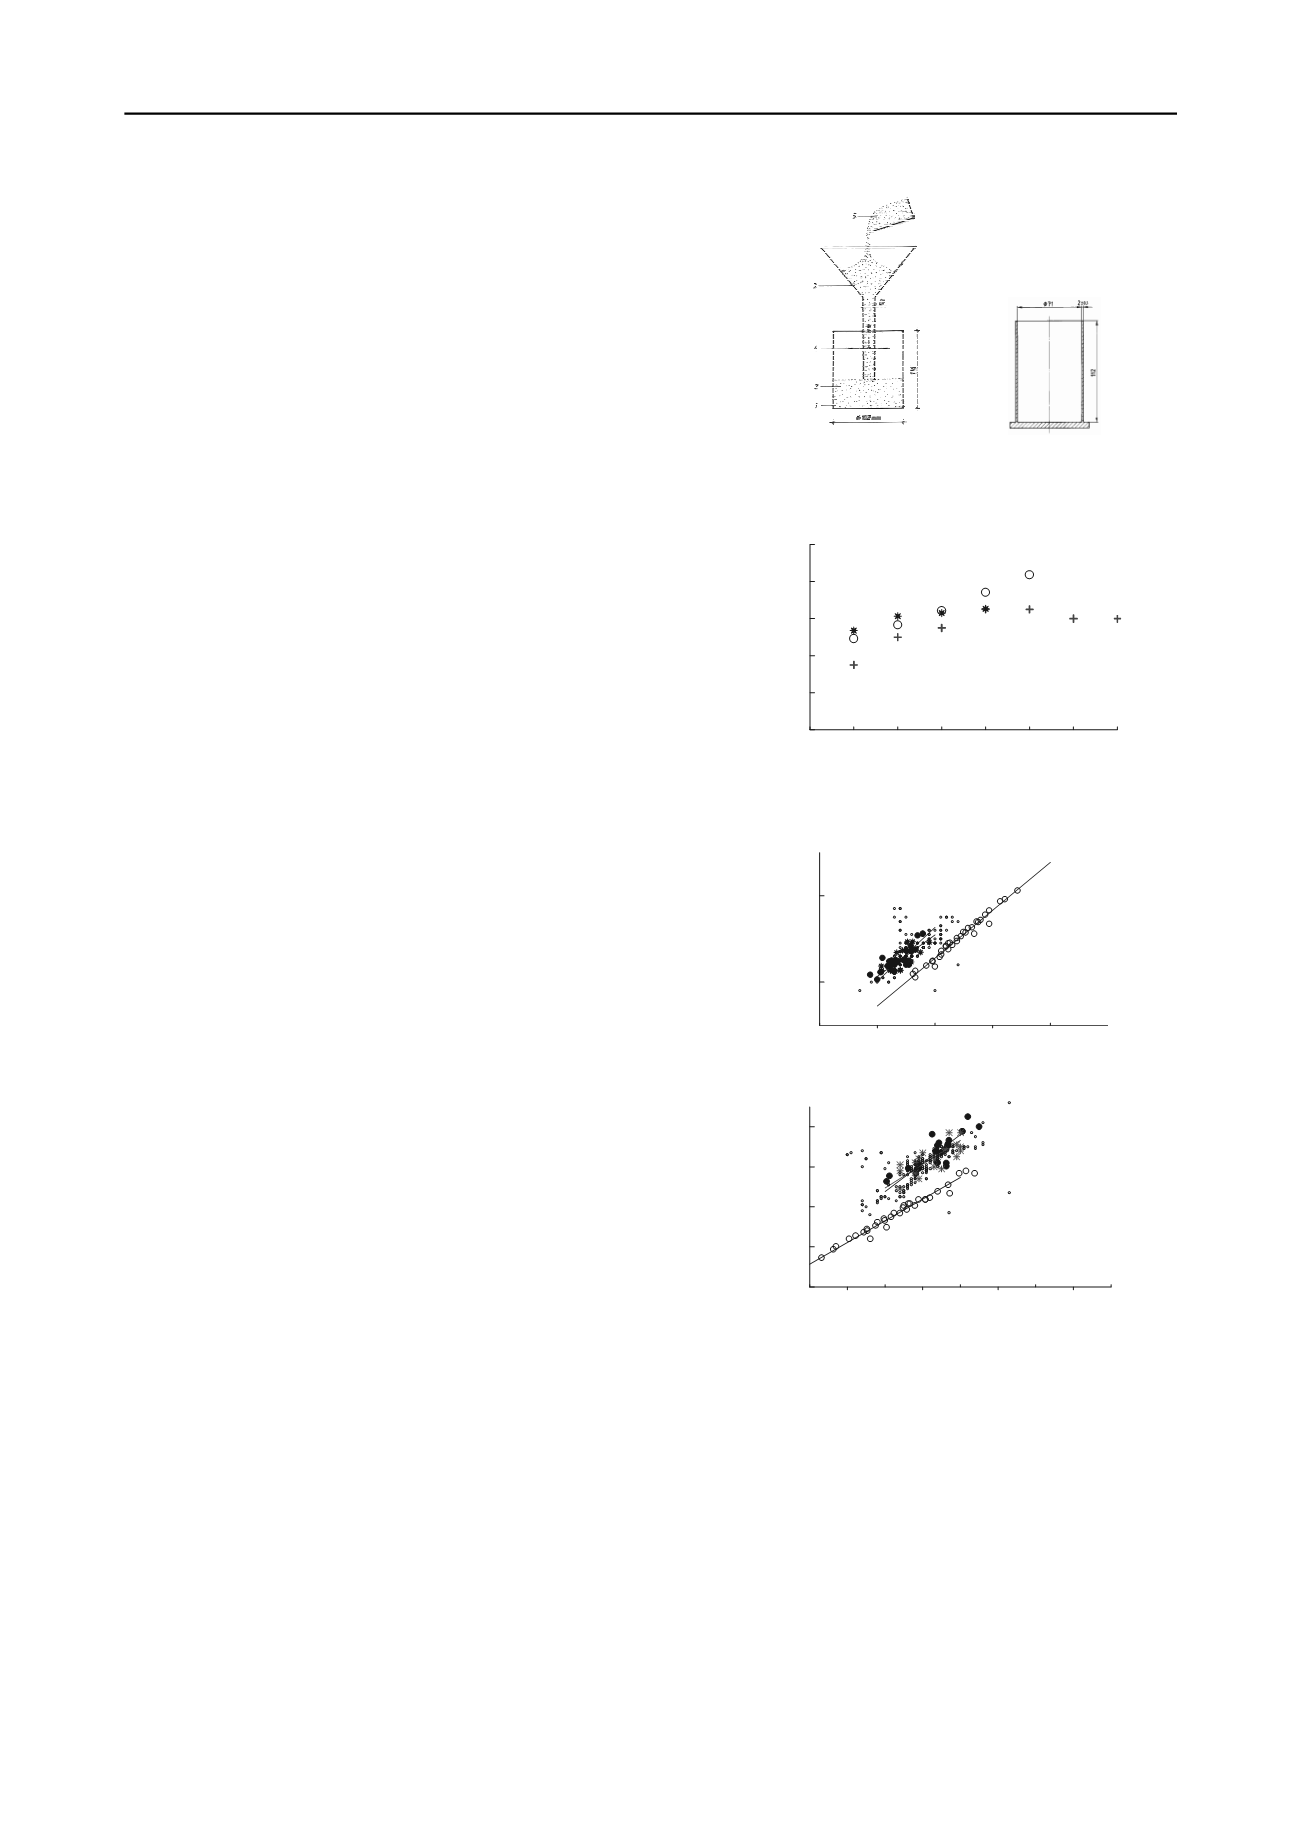
(a)
(b)
Figure 1. The molds (a) Proctor (d=100 mm, h=112mm) (b) DIN
(d=71mm,h=112mm). Note the same height and different width.
0
1 2
3
4 5
6
7
Fraction number
0.4
0.4
0.5
0.5
0.6
0.6
smin [-]
Figure 2. Fract
ion measurement of Lőrincz (1976), indicated by open
circles, note the bias from fraction 3 (0.25 to 0.5 mm) in the new data.
0.4
0.6
0.8
s min [-]
0.6
0.8
s max [-]
Calibration
Chamber
sands - Group II.
Danube sand
- Group I.
Danube sand
- Group III
Figure 3. All data (Groups I to IV),
s
min
–
s
max
0.2
0.4
0.6
0.8
1.0
e min [-]
0.2
0.4
0.6
0.8
1.0
e max [-]
Calibration
chamber sand
Group II
Danube sand
- Group I
Danube sand
- Group III
Figure 4. All data (Groups I to IV),
e
min
- e
ma
If the variables are independent, Pearson's correlation
coefficient is 0, but the converse is not true, the correlation
coefficient detects only linear dependencies. The parameters of
the best fit linear function are as follows (
E
denotes expected
value which can be approximated by the mean value):
)(
)(
), ( /)(
x aE yEb x y a
[4]
3 INDIVIDUAL GROUP RESULTS
The results of the density tests for groups I to IV are
summarized in Figures 3 to 6 where the small open circles are
related to the Group IV. The results are presented in Tables 1 to
4 in statistical viewpoint.


