351
Technical Committee 101 - Session II /
Comité technique 101 - Session II
Proceedings of the 18
th
International Conference on Soil Mechanics and Geotechnical Engineering, Paris 2013
3.1
Danube Sands data - Group I
In the work of Kabai (1972) the minimum and maximum dry
densities are presented for Danube sand mixtures. From these,
the void ratios
e
and the solid volume ratios
s
were computed
and their ratios were determined (Table 1). The mean of the
s
min
and
s
max
values are 0.640 and 0.700, with mean coefficients of
variation of 0.070 and 0.072, respectively. The mean of the
s
ratio (
s
min
/ s
max
) is equal to 0.915 with a coefficient of variation
CV
=0.0116, indicating that the
s
ratio is practically constant.
The mean of the
e
max
and
e
min
values are 0.569 and 0.436, with
coefficients of variation of 0.192 and 0.234, respectively. The
mean of the
e
min
/ e
max
is equal to 0.760 with a coefficient of
variation
CV
=0.060.
3.2
The Calibration Chamber sand data
–
Group II
The mean of the
s
min
and
s
max
values are 0.536 and 0.652, with
the coefficients of variation of 0.045 and 0.039, resp. (Table 2).
The mean of the
s
ratio (
s
min
/ s
max
) is equal to 0.822 with a
coefficient of variation
CV
=0.024. The mean
e
max
and
e
min
values
are 0.870 and 0.536, with coefficients of variation of 0.097 and
0.110, respectively. The mean of the
e
min
/ e
max
is equal 0.617
with a coefficient of variation of
CV
=0.061. The mean of the
e
max
and
e
min
values are 0.810 and 0.496, with coefficients of
variation of 0.114 and 0.159, respectively. The mean of the
e
min
/ e
max
is equal to 0.610 with a coefficient of variation
CV
=0.082.
3.3
Danube Sands data
–
Group III
The minimum and maximum dry densities for 24 Danube sand
mixtures are shown
in
Table 3. The mean of the
s
min
and
s
max
values are 0.554 and 0.670, with mean coefficients of variation
of 0.052 and 0.053, respectively. The mean of the
s
ratio (
s
min
/
s
max
) is equal to 0.827 with a coefficient of variation
CV
=0.025,
indicating that the
s
ratio is practically constant.
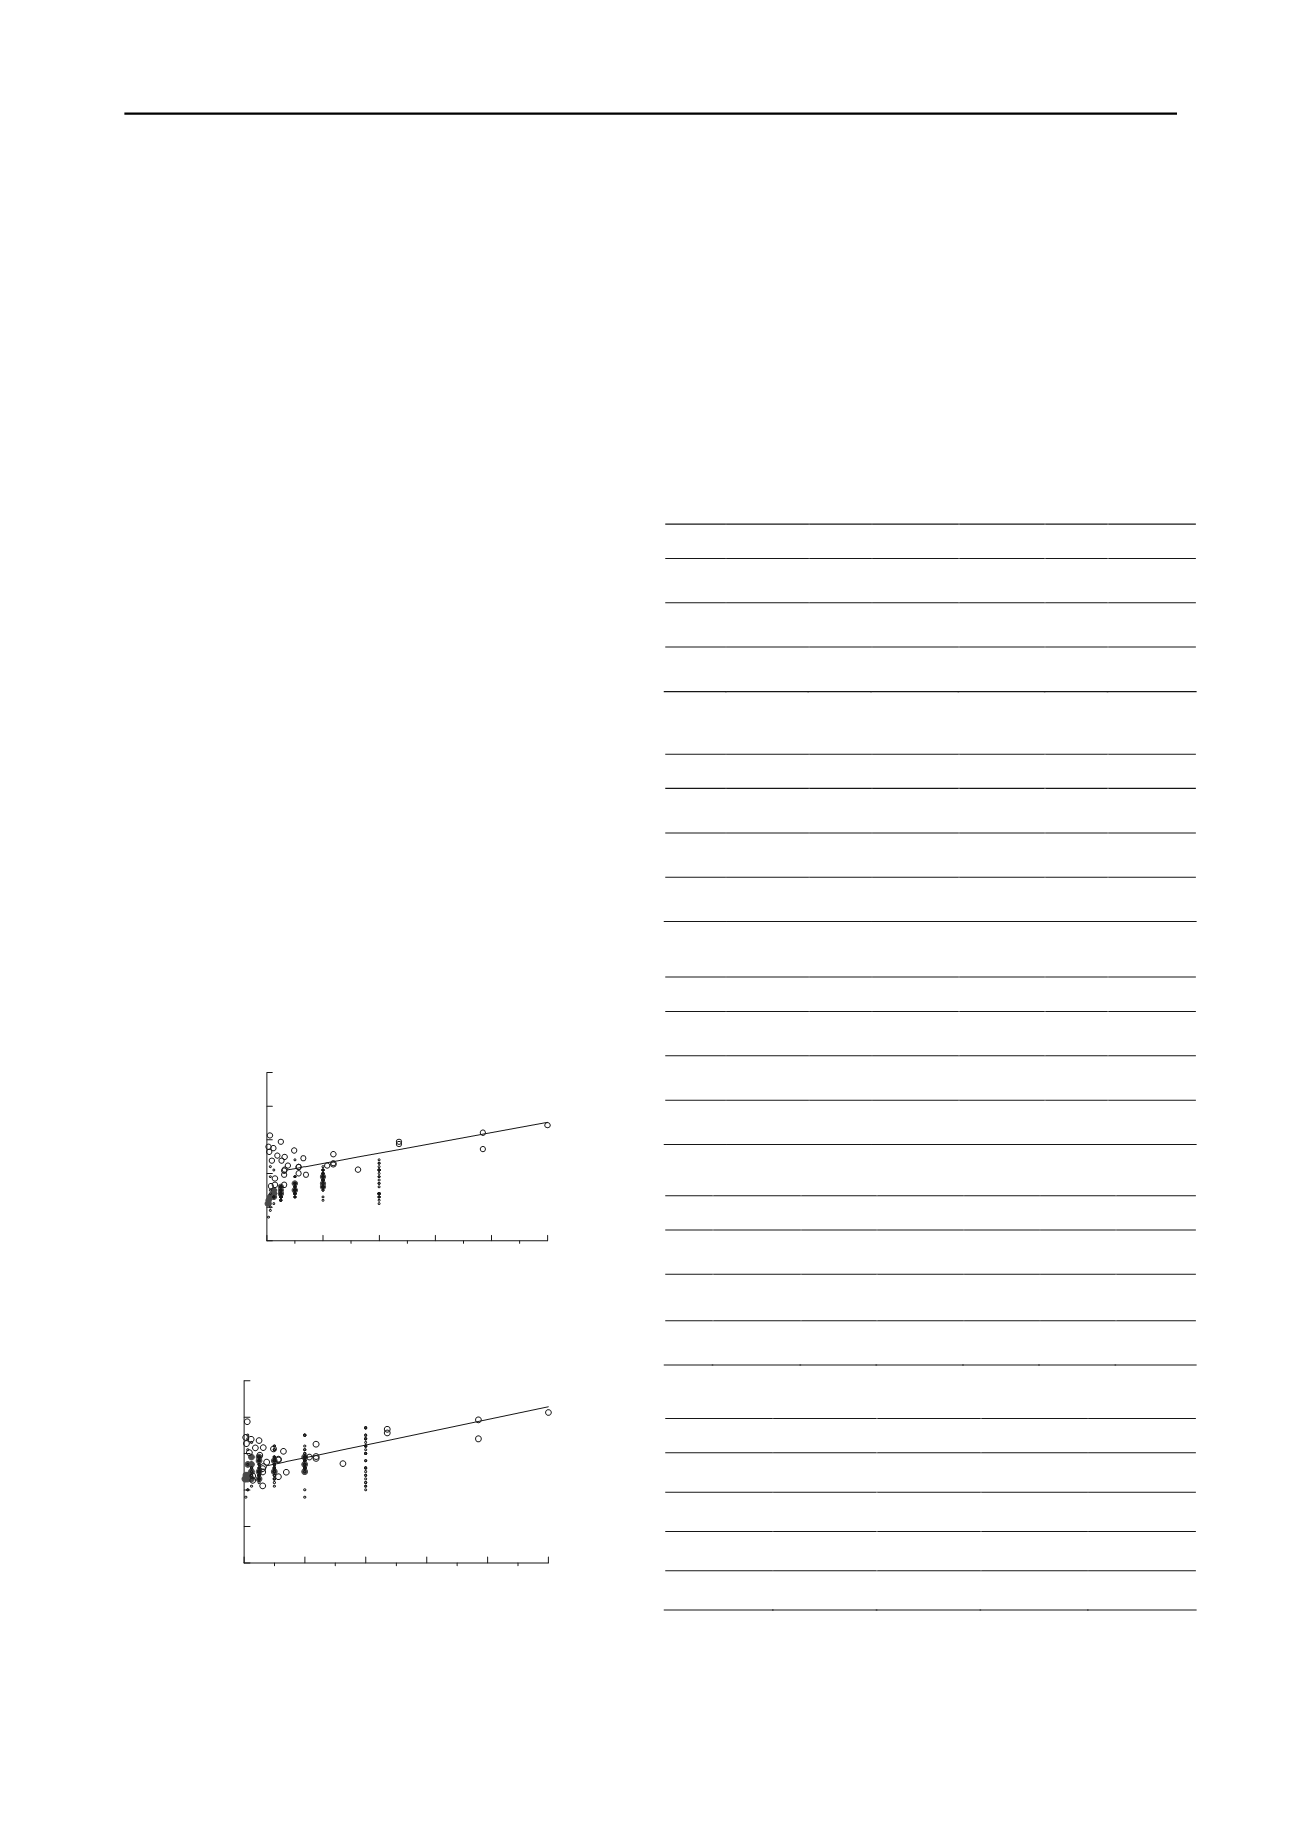
0.0
4.0
8.0
12.0 16.0 20.0
d max [mm]
0.4
0.5
0.6
0.7
0.8
0.9
smin [-]
Danube sand -
Group I
Danube sand -
Group III
Figure 5. Groups I, III to IV data,
s
min
and maximum diameter. Note that
the small open circles are
’below’
the linear trend of Group I
0.0
4.0
8.0
12.0 16.0 20.0
d max [mm]
0.4
0.5
0.6
0.7
0.8
0.9
smax [-]
Danube sand -
Group I
Danube sand -
Group III
Figure 6. Groups I, III to IV data,
s
max
and maximum diameter. Note
that the small open circles are
’centered’
the linear trend of Group I
3.4
Bochum Sand data
–
Group IV
The minimum and maximum dry density results of the newly
measured 182 Bochum sand mixtures are shown
in
Table 4.
The mean of the
s
min
and
s
max
values are 0.557 and 0.671,
with mean coefficients of variation of 0.054 and 0.053,
respectively. The mean of the
s
ratio (
s
min
/ s
max
) is equal to
0.831 with a coefficient of variation
CV
=0.044, indicating that
the
s
ratio is practically constant.
The mean of the
e
max
and
e
min
values are 0.801 and 0.495,
with coefficients of variation of 0.119 and 0.161, respectively.
The mean of the
e
min
/ e
max
is equal to 0.619 with a coefficient of
variation
CV
=0.125.
Table 1. Results of the statistical evaluation
–
Group
s
min
s
max
ratio
s
e
max
e
min
ratio
e
X 0.640 0.700 0.915
0.569
0.436 0.760
0.045 0.050 0.011
0.109
0.102 0.045
CV 0.070 0.072 0.012
0.192
0.234 0.060
Table 2. Results of the statistical evaluation
–
Group II
s
min
s
max
ratio
s
e
max
e
min
ratio
e
X 0.536 0.652 0.822
0.870
0.536 0.617
0.024 0.026 0.020
0.084
0.059 0.038
CV 0.045 0.039 0.024
0.097
0.110 0.061
Table 3. Results of the statistical evaluation - Group III
s
min
s
max
ratio
s
e
max
e
min
ratio
e
X 0.554 0.670 0.827
0.810
0.496 0.610
0.029 0.036 0.021
0.092
0.079 0.050
CV 0.052 0.053 0.025
0.114
0.159 0.082
Table 4. Results of the statistical evaluation - Group IV
s
min
s
max
ratio
s
e
max
e
min
ratio
e
X 0,557
0,671 0,831
0,801 0,495 0,619
0,030
0,036 0,037
0,095 0,080 0,077
CV 0,054
0,054 0,044
0,119 0,161 0,125
Table 5. Results of the statistical tests -
s
min
I
II
III
IV
I
+
-
-
-
II
-
+
+
-
III
-
+
+
IV
-
-
+


