358
        
        
          Proceedings of the 18
        
        
          th
        
        
          International Conference on Soil Mechanics and Geotechnical Engineering, Paris 2013


            Proceedings of the 18


            th


            International Conference on Soil Mechanics and Geotechnical Engineering, Paris 2013


          method for frost susceptibility of soils, which uses specimens in
        
        
          a disk form 10 cm in diameter and 5 cm in thickness and is
        
        
          capable of falling head permeability tests using a burette before
        
        
          and after a freeze-thaw cycle (designated hereinafter as the frost
        
        
          heave test apparatus capable of permeability tests). The second
        
        
          is a frost heave test apparatus equipped with bender elements
        
        
          (BEs) for measuring the velocity of shear waves propagating in
        
        
          the specimen before and after a freeze-thaw cycle (designated
        
        
          hereinafter as the frost heave test apparatus equipped with BEs).
        
        
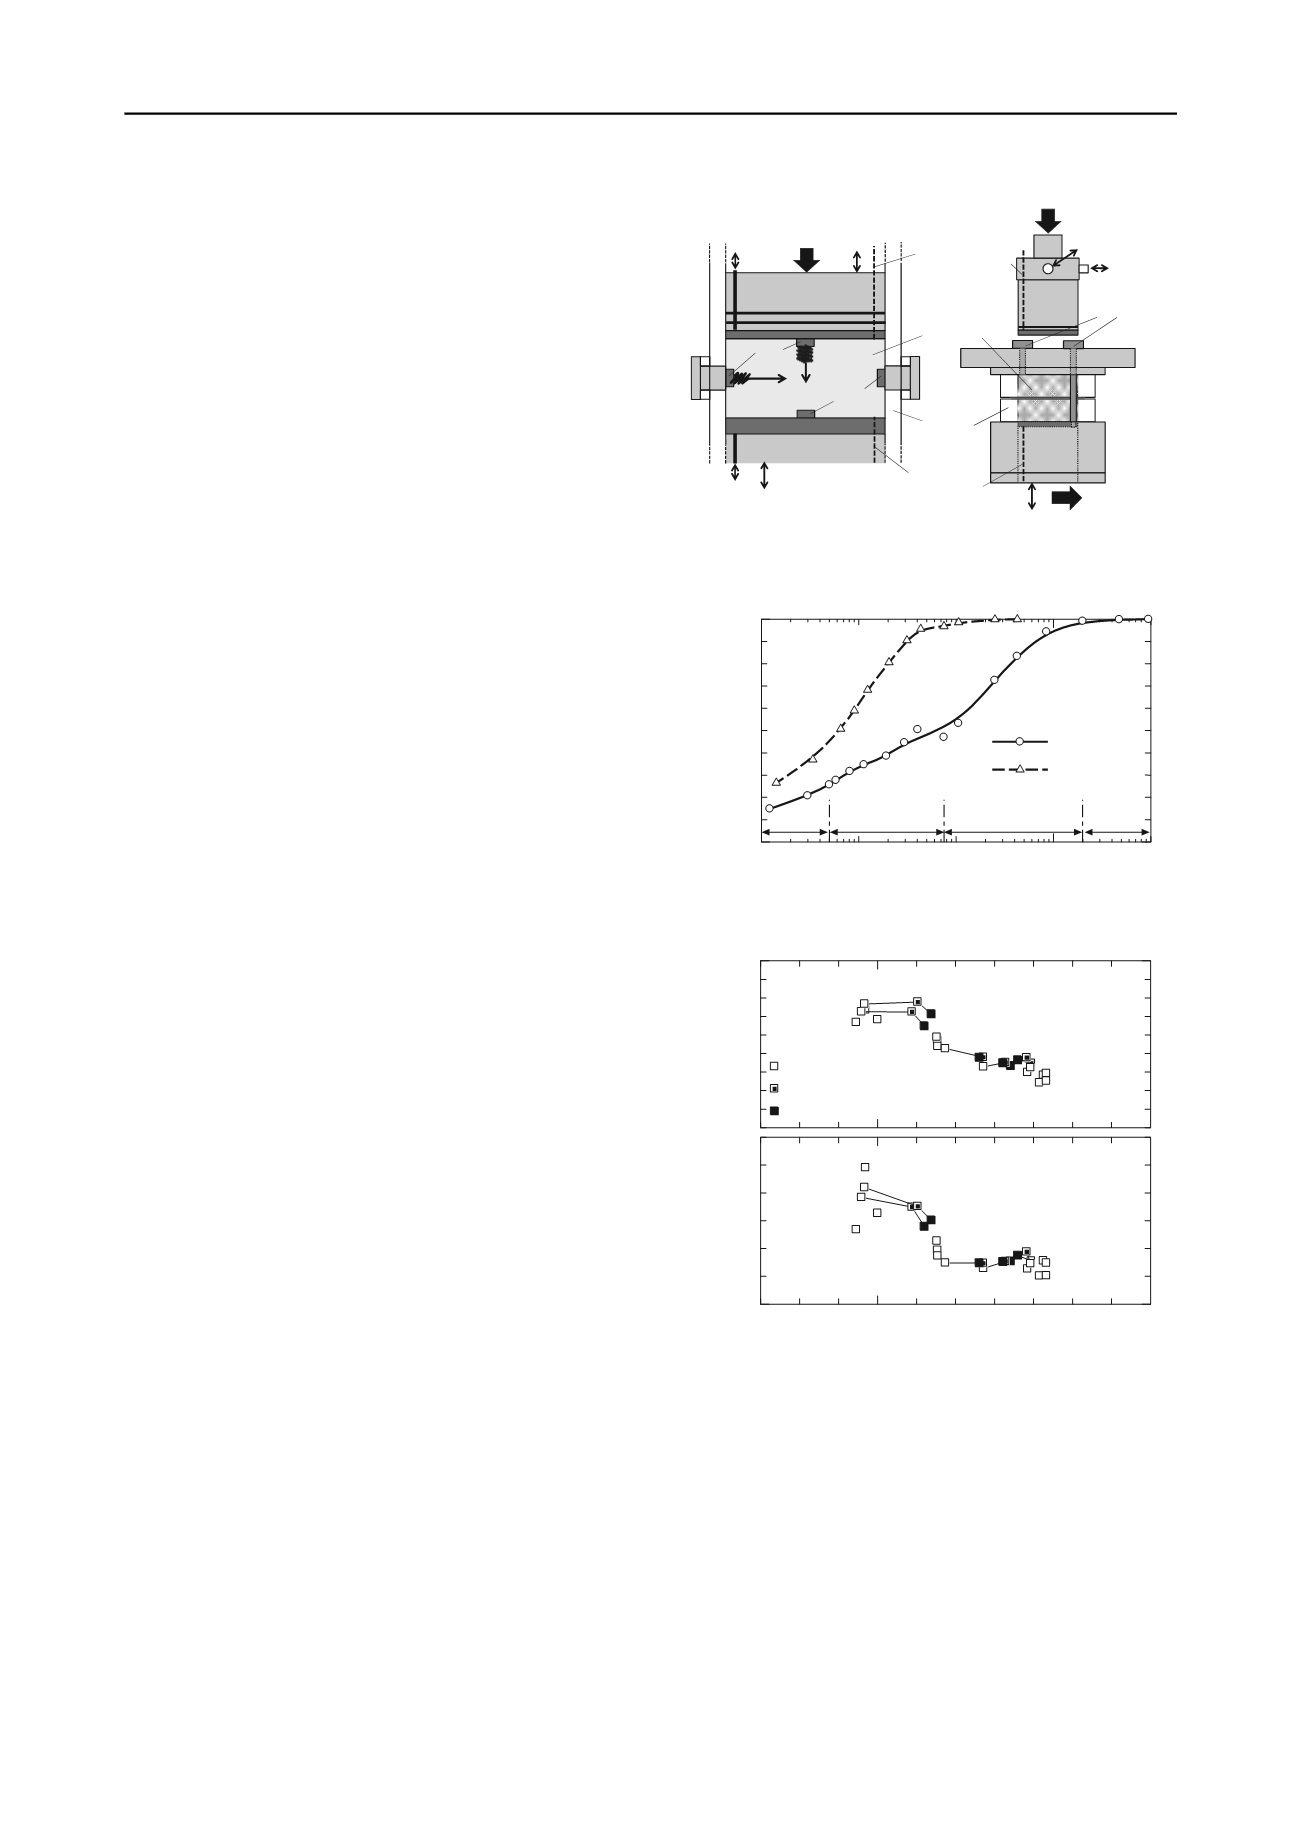
          As shown schematically in Figure 2a, two pairs of BEs are
        
        
          provided, in the upper and lower plates and in the mold,
        
        
          respectively. The BE pair in the cooling plates measures the
        
        
          velocity (
        
        
          V
        
        
          s
        
        
          )
        
        
          vh
        
        
          of the shear wave that oscillates horizontally and
        
        
          propagates vertically, while the BE pair in the mold measures
        
        
          the velocity (
        
        
          V
        
        
          s
        
        
          )
        
        
          hh
        
        
          of the share wave that oscillates and
        
        
          propagates horizontally (Kawaguchi et al. 2001, Yamashita and
        
        
          Suzuki 2001). The BE pair in the mold was removed in freeze-
        
        
          thaw tests to avoid any damage by freezing, and mounted again
        
        
          after thawing for BE tests. The third apparatus is a direct box
        
        
          shear test apparatus that permits freeze-thaw test in the shear
        
        
          box (designated hereinafter as the temperature-controllable
        
        
          direct box shear apparatus). The shear box is schematically
        
        
          represented in Figure 2b. The specimen is a disk 6 cm in
        
        
          diameter and 4 cm in thickness. A coolant is circulated in the
        
        
          piston and pedestal for temperature control. The shear box, or
        
        
          the circumferential surface of the specimen, is thermally
        
        
          insulated by a two-centimeter-thick acrylic resin layer. A rubber
        
        
          sheet, 0.3 mm in thickness, is placed between the upper and
        
        
          lower halves of the shear box during freeze-thaw tests to
        
        
          prevent water leakage, and is removed for shear tests to leave a
        
        
          0.2mm clearance between the box halves.
        
        
          Figure 3 shows grain size distribution curves for the two
        
        
          frost-susceptible fine-grain soils used in this study. One is
        
        
          weathered volcanic ash obtained at Kitami City, Hokkaido
        
        
          (sample V) which was used in the tests using the two frost
        
        
          heave test apparatus. The test specimens were prepared by
        
        
          compacting the volcanic ash sample conditioned to be slightly
        
        
          drier than with the optimum water content. The other, used in
        
        
          the temperature-controllable direct box shear tester, is a mixture
        
        
          of clay commercially available in dry powder and silt at a ratio
        
        
          of 1:1 by weight, which was made to a slurry at twice the liquid
        
        
          limit and then consolidated one-dimensionally to a vertical
        
        
          stress


          v
        
        
          = 100 kPa (sample CL,
        
        
          w
        
        
          L
        
        
          = 38%,
        
        
          I
        
        
          P
        
        
          = 19).
        
        
          3 RESULTS AND DISCUSSION
        
        
          3.1
        
        
          Void ratio and coefficient of permeability
        
        
          Falling head permeability tests were performed before and after
        
        
          the freeze-thaw tests using the frost heave test apparatus in
        
        
          order to study effects of freeze-thaw cycles on the void ratio
        
        
          e
        
        
          and the coefficient of permeability
        
        
          k
        
        
          . Sixteen specimens were
        
        
          prepared using a rammer and a mold at three levels of
        
        
          compaction energy: 126, 284, and 550 kJ/m
        
        
          3
        
        
          (Nakamura et al.
        
        
          2011). The vertical stress was


          v
        
        
          =10 kPa for all the tests. Six of
        
        
          the specimens underwent three freeze-thaw cycles and
        
        
          k
        
        
          was
        
        
          measured before and after each cycle. The frost heave test
        
        
          method specified in the JGS 0172-2009 standard was used. In
        
        
          the thawing tests, the specimen was dewatered through the top
        
        
          and bottom surfaces held at 5


          C, and then saturated again.
        
        
          Figure 4 shows the rate of frost heave
        
        
          U
        
        
          h
        
        
          (mm/h) and frost
        
        
          heave ratio
        
        
          ξ
        
        
          (%) of the specimen as functions of void ratio
        
        
          e
        
        
          at
        
        
          the beginning of freezing. A greater
        
        
          e
        
        
          means more pore water
        
        
          and lower tensile strength, which might suggest easier ice lens
        
        
          formation. Actually, however, both
        
        
          U
        
        
          h
        
        
          and
        
        
          ξ
        
        
          are lower at higher
        
        
          e
        
        
          at the beginning of freezing, presumably because of inhibition
        
        
          of continuity of the unfreezable water needed for frost heave
        
        
          (Nakamura et al. 2011). The results of the three consecutive
        
        
          freeze-thaw cycles, indicated by the points connected with lines,
        
        
          show that the repeated cycles lead to convergence to fairly
        
        
          constant values of
        
        
          U
        
        
          h
        
        
          and
        
        
          ξ
        
        
          .
        
        
          Figure 5 represents changes in the void ratio
        
        
          e
        
        
          and
        
        
          coefficient of permeability
        
        
          k
        
        
          of the specimen through the freeze-
        
        
          thaw cycles. The data for each specimen are connected by lines.
        
        
          As observed in Figure 4, the freeze-thaw cycles decrease greater
        
        
          initial
        
        
          e
        
        
          values and increase smaller initial
        
        
          e
        
        
          values, eventually
        
        
          leading to convergence to a relatively limited range of
        
        
          e
        
        
          values
        
        
          between 1.1 and 1.3. Ono et al.(2003) reported that freeze-thaw
        
        
          history decreases
        
        
          e
        
        
          of clay at a normally consolidated state and
        
        
          increases
        
        
          e
        
        
          of clay with a larger over consolidation ratio. This
        
        
          observation is in agreement with the present results assuming
        
        
          that higher compaction energies on the specimen result in over
        
        
          consolidation in terms of the specimen’s mechanical
        
        
          0.001
        
        
          0.01
        
        
          0.1
        
        
          1
        
        
          10
        
        
          0
        
        
          20
        
        
          40
        
        
          60
        
        
          80
        
        
          100
        
        
          Percent passing (%)
        
        
          Grain size
        
        
          Clay
        
        
          Silt
        
        
          Sand
        
        
          Gravel
        
        
          : Sample V
        
        
          : Sample CL
        
        
          Screw
        
        
          Resistance
        
        
          temperature
        
        
          detector
        
        
          Acrylic
        
        
          resin
        
        
          Coolant
        
        
          Specimen
        
        
          (mm)
        
        
          Figure 2. Test apparatus diagrams (a): frost heave apparatus equipped
        
        
          with BEs, b): temperature-controllable direct box shear apparatus)
        
        
          Figure 3. Grain size distribution of samples used in the tests
        
        
          Figure 4.
        
        
          U
        
        
          h
        
        
          and
        
        
          ξ
        
        
          as functions of
        
        
          e
        
        
          at the beginning of freezing
        
        
          Water


            Vertical stress


          Water


            BE


          (


            V


          s
        
        
          )
        
        
          vh
        
        
          (


            V


          s
        
        
          )
        
        
          hh


            BE


          Upper plate
        
        
          Lower plate
        
        
          Piston


            Shear


            Vertical stress


          Coolant
        
        
          Coolant
        
        
          Coolant
        
        
          Water
        
        
          Resistance
        
        
          temperature
        
        
          detector
        
        
          a)
        
        
          b)
        
        
          0.2
        
        
          0.4
        
        
          0.6
        
        
          0.8
        
        
          1.0
        
        
          Rate of frost heave
        
        
          : Cycle 1
        
        
          : Cycle 2
        
        
          : Cycle 3
        
        
          Sample V
        
        
          U
        
        
          h
        
        
          (mm/h)
        
        
          0.8
        
        
          1.0
        
        
          1.2
        
        
          1.4
        
        
          1.6
        
        
          0
        
        
          40
        
        
          80
        
        
          120
        
        
          Frost heave ratio
        
        
          Void ratio at the beginning of freezing,
        
        
          e


          (%)