367
Technical Committee 101 - Session II /
Comité technique 101 - Session II
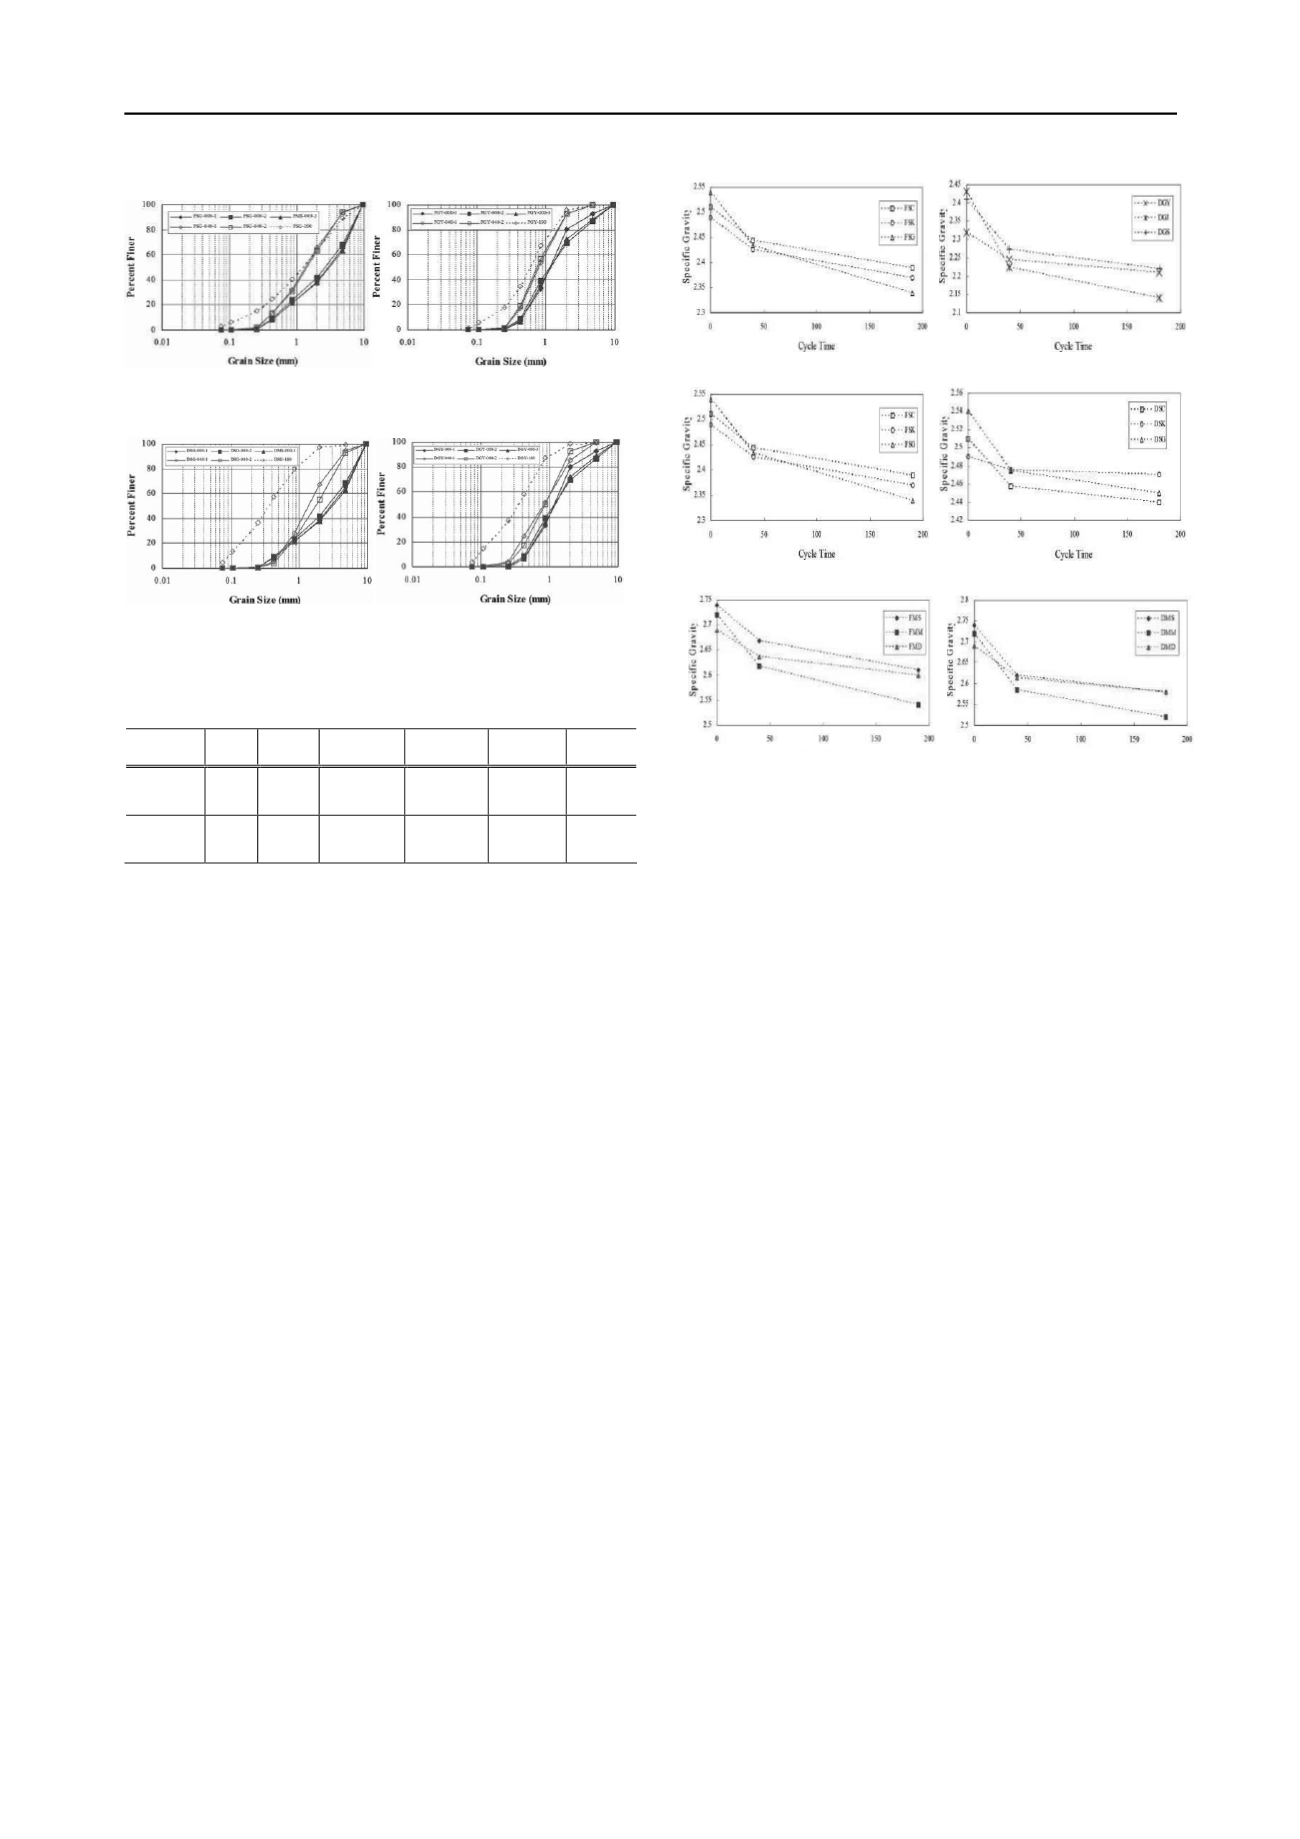
Figure 1. Grain-size distribution change caused by freezing and thawing
repetition
Figure 2. Grain-size distribution change caused by drying and wetting
repetition
Table 2. Increase of fine grain by the change of weathering degree (unit
: %)
The previous studies suggest that among primary minerals in
weathering soil, especially feldspar and mica change selectively
as weathering proceeds that it is possible to apply them as an
index for weathering degree when distinguishing these
components and measuring their specific gravities(Matsuo,
1979). This study is intended to measure the outward specific
gravities and understand the changes according to the
weathering progress.
First of all, after testing the samples with the freezing and
thawing and the drying and wetting repeated 0, 40, and 190(180
for drying and wetting) times respectively according to KSF
2308, it turned out that the specific gravity soil particles
decreases as the number of repetitions increases.
Figure 3 shows the change of specific gravity by the freezing
and thawing repetition, signifying the specific gravity change
appears high in the beginning of the repetition. Comparing the
specific gravities in the beginning by parent rocks, it shows that
metamorphic rock has the biggest one followed by sedimentary
rock, and igneous rock has the lowest one, but for the
decreasing specific gravity from the result of the weathering
change test, it shows that sedimentary rock and metamorphic
rock have a similar change while igneous rock has a
comparatively smaller change.
Next, the change of specific gravity by the drying and
wetting repetition are divided by parent rocks and shown in
Figure 4, which indicates that the change of specific gravity
decreases as the number of repetitions increases just like the
freezing and thawing repetition, and the change in the beginning
of the repetition appears great.
However, when comparing the decreasing specific gravities
from the result of the weathering change test, igneous rock takes
the highest one followed by metamorphic rock, and sedimentary
rock takes the lowest one, which is different from the freezing
and thawing case. Therefore, with the effect factors of
weathering that causes the change of specific gravity, it is
judged that the weathering by water has a more dominant effect
on the change of specific gravity than that by temperature
change.
(a) Igneous rock
(a) Igneous rock
(b) Sedimentary rock
(b) Sedimentary rock
Nevertheless, the real specific gravity of weathering soil
changes very little, but feldspar and mica are changed
selectively by the weathering that it is acknowledged that a
comprehensive change trend should be traced after measuring
the specific gravities of feldspar and mica.
3.3. Strength Characteristic Change
Figure 5 and Figure 6 are the result of an uniaxial
compression test after thawing and drying so as to know the
progress of strength changes due to the changes in the numbers
of the freezing and thawing and the drying and wetting. In
general, as the repetition number of freezing and thawing
increased, the compression stress of each sample decreased by a
similar ratio. The initial stress of each sample appeared different
while the compression stress during the 190 time repetitions has
a little difference.
In other words, the strength change in the beginning by the
freezing and thawing is significant, which is similar to the study
result that Yong et al.(1985) reported the strength decrease by
the first repetition is the biggest. Compared with igneous rock,
sedimentary rock and metamorphic rock shows a bigger
strength decrease by the freezing and thawing repetition.
For the drying and wetting repetition, the strength by the
increase of repetition number continued to decrease with a
bigger change in the beginning than the overall decreasing
tendency. The uniaxial compression strength by the change of
weathering degree decreases similarly for all the samples, but
the axial deformation rate increases as the repetition numbers of
the freezing and thawing and the drying and wetting increase.
In other words, the softening of deformation rate appears in
the initial result of the compression test, while the hardening of
deformation rate becomes vivid as the repetition numbers of the
freezing and thawing and the drying and wetting.
The reason why the strength decreases as the repetition
number of the freezing and thawing increases, is not that the
strength rovers completely due to thawing but it turns to the
state with a certain degree of strength decrease and back to the
Division Seoul Jeonju Cheongdo Goryeong Gwangju
Sabuk
Freezing/
thawing
1.6
1.7
2.5
2.8
2.5
3.5
Drying/
wetting
3.2
5.9
3.3
4.6
1.6
0.8
(c) Metamorphic rock
(c) Metamorphic rock
Figure 3. Change of Specific
Gravity by Freezing and Thawing
Repetition
Fig
ure 4. Change of Specific
Gravity by Drying and Wetting
Repetition


