370
Proceedings of the 18
th
International Conference on Soil Mechanics and Geotechnical Engineering, Paris 2013
Proceedings of the 18
th
International Conference on Soil Mechanics and Geotechnical Engineering, Paris 2013
The specimens are 5cm in diameter and 10cm in height.
The maximum dry density and the optimum water content of
the mechanically stabilized soil were 2.0g/cm
3
and 10.5%,
respectively. Three degrees of compaction are adopted, i.e.,
D
=
80, 85 and 90%, in which the dry densities are 1.6, 1.7 and
1.8g/cm
3
. The test sample was mixed well by adding water to be
the prescribed initial water contents. Then, the moisture-
controlled sample was compacted to reconstitute it to the
prescribed degree of compaction. The compaction was carried
out by dividing the sample into five layers to make
homogeneous specimens. In this study, ‘initial water content’
denotes the water content of the sample during the specimen
preparation. All the specimens in this test were fully saturated,
i.e., a
B
value of over 0.95, after setting them in a triaxial
chamber by the double-vacuum method. Therefore, the effects
of suction in the specimens are negligible in the evaluation of
the test results.
In all the test cases, an isotropic consolidation was
performed by applying an effective confining pressure of
100kPa, and then an undrained shear was conducted using the
loading speed of 0.1%/min.
3 TEST RESULTS
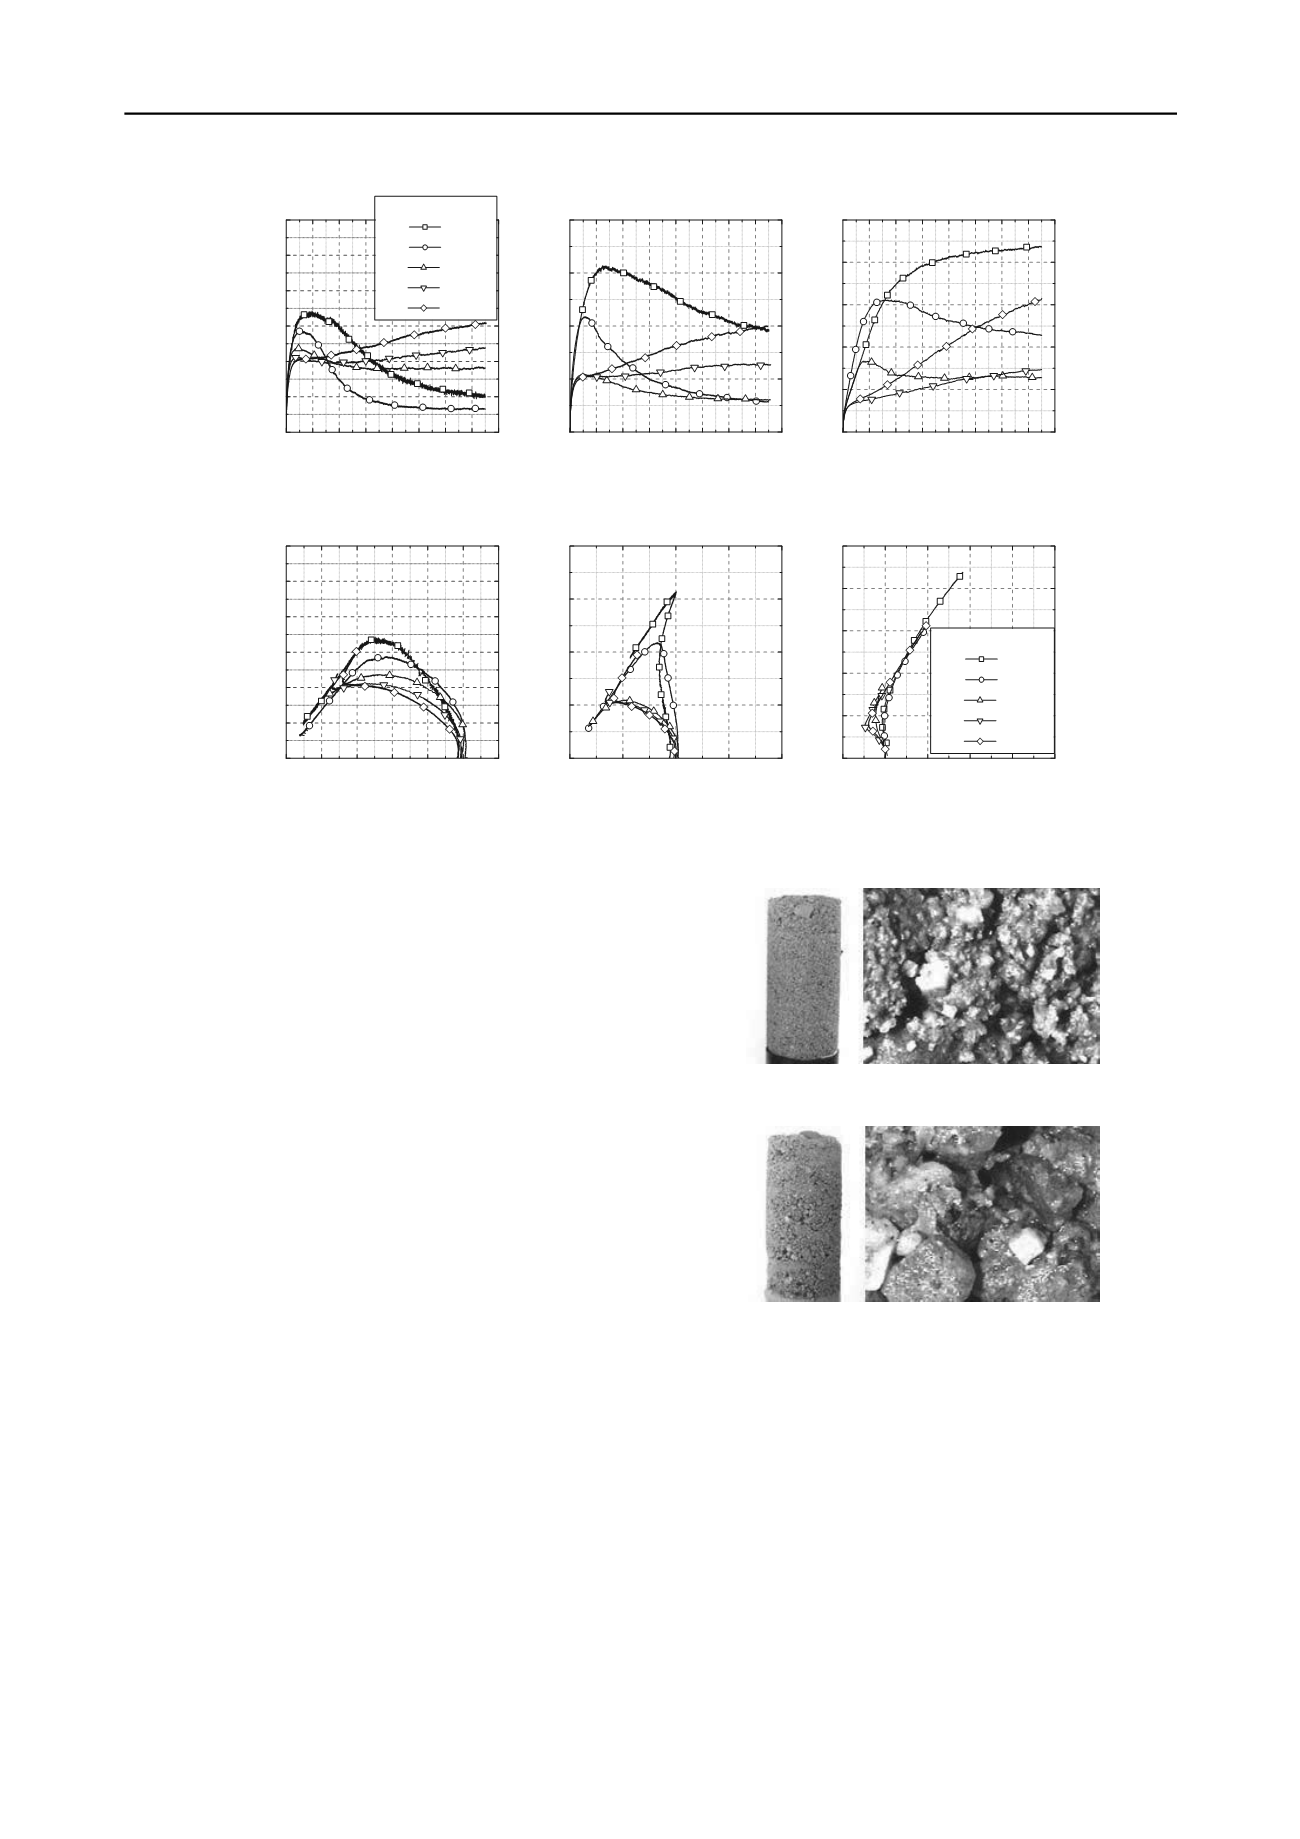
Figures 2 and 3 illustrate the stress-strain relations and the
effective stress paths, respectively. For each degree of
compaction, strain-softening behavior can be observed in the
cases of high initial water content. On the other hand, only the
strain-hardening behavior can be seen in the cases of low initial
water content. In particular, this tendency is very clear in the
case of the degree of compaction of
D
=85%. The specimens
with 10% and 14% initial water contents show remarkable
elastic characteristics in the early loading stage, i.e., large shear
rigidity and
p
’=constant behavior. Then, significant strain
softening, accompanied by plastic volumetric compression,
occurs.
Photos 1 and 2 show views of the reconstituted specimens
with initial water contents of 10% and 0%, respectively. An
overview of the specimen and a surface image observed by a
microscope are exhibited in each case. The degree of
compaction for both specimens is
D
=90%. From the overviews,
the specimen with the 10% initial water content looks
homogeneous. On the other hand, the specimen with the 0%
initial water content looks uneven. In other words, there are two
areas which containing rich coarse particles or rich fine particles.
From the enlarged surface images, many fine particles sticking
to coarse particles can be observed in the specimen with the
10% initial water content. Since relatively high suction existed
in the specimen with 10% initial water content during the
specimen preparation, the fine particles must be uniformly
distributed around the coarse particles. This distribution may
cause a highly structured soil skeleton. In the case of the initial
water content of 0%, since dry particles without suction were
used for the specimen preparation, the classification of coarse
and fine particles may have occurred during the compaction.
0 100 200 300 400 500
0
100
200
300
400
500
q
(kPa)
p'
(kPa)
0 2 4 6 8 10 12 14 16
0
20
40
60
80
100
120
q
(kPa)
ε
(%)
Initial water content
14%
10%
5%
3%
0%
0 20 40 60 80 100 120
0
20
40
60
80
100
120
q
(kPa)
p'
(kPa)
Initial water content
14%
10%
5%
3%
0%
0 2 4 6 8 10 12 14 16
0
50
100
150
200
ε
(%)
q
(kPa)
(a) D=80%
(b) D=85%
(c) D=90%
(a) D=80%
(b) D=85%
(c) D=90%
0 2 4 6 8 10 12 14 16
0
100
200
300
400
500
q
(kPa)
ε
(%)
0 50 100 150 200
0
50
100
150
200
Figure 2. Deviator stress – axial strain relations of gravel-mixed sand with various initial water contents.
q
(kPa)
p'
(kPa)
Figure 3. Effective stress paths of gravel-mixed sand with various initial water contents.
Photo 1. Overview of the specimen (left) and a surface image observed
by a microscope (right) for initial water content 10%.
Photo 2 Overview of the specimen (left) and a surface image observed
by a microscope (right) for initial water content 0%.


