379
Technical Committee 101 - Session II /
Comité technique 101 - Session II
Proceedings of the 18
th
International Conference on Soil Mechanics and Geotechnical Engineering, Paris 2013
Measured
LS
DS
Measured
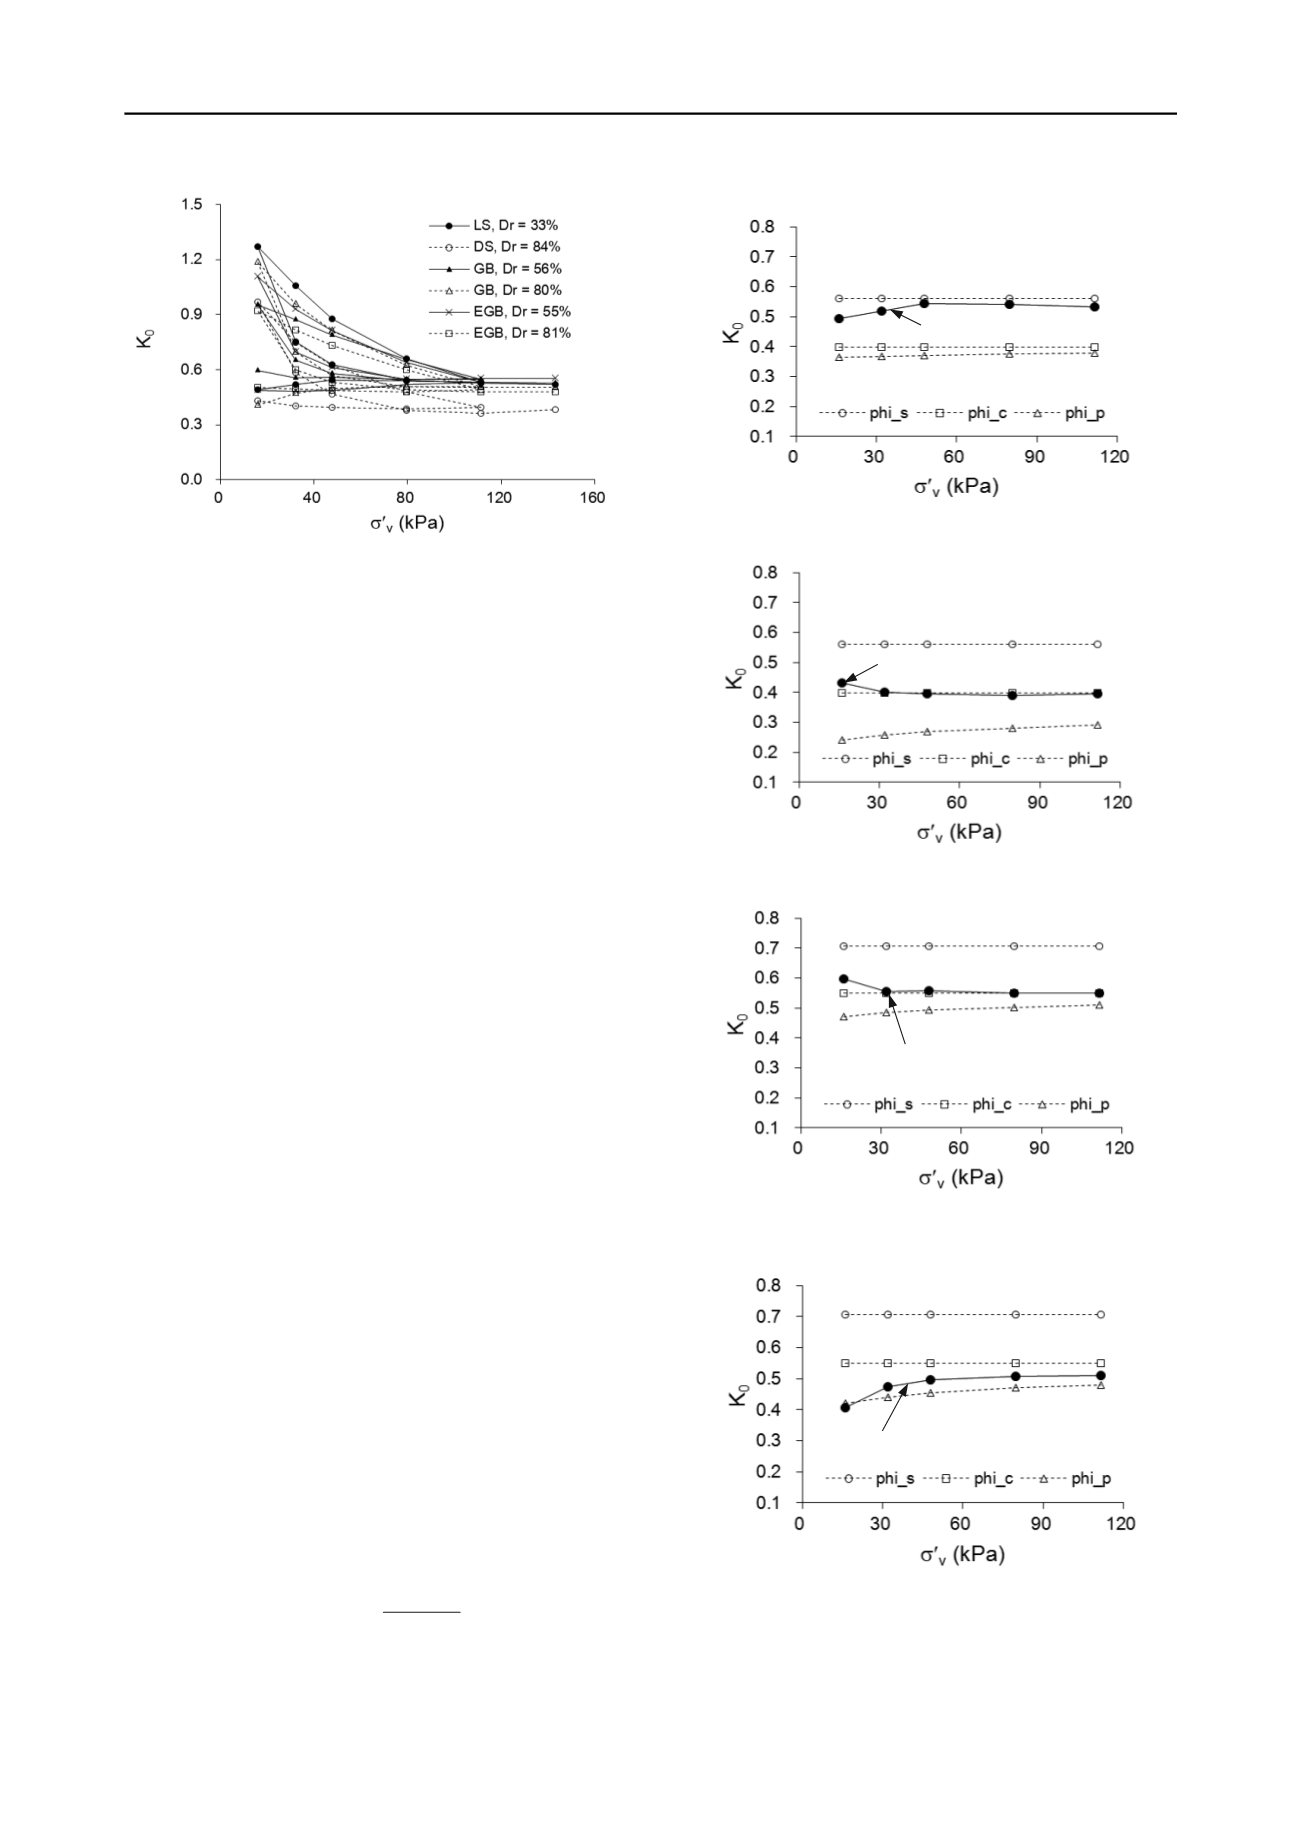
Fig. 3 Values of K
0
with
v
for test granular materials of Jumunjin sand
(LS and DS) and glass beads with and without etching (GB, EGB).
vertical stress direction due to higher interlocking, which leads
to lower K
0
during loading. The horizontally interlocked stress
induces the increase of K
0
during unloading whereas the partial
release of the horizontal stress during reloading makes the
evolution of K
0
run between loading and unloading stages. Once
the stress reaches the preconsolidation stress, K
0
remains
constant as the normally consolidation condition prevails.
The effect of particle shape and angularity on K
0
was
investigated by directly comparing the test results from
Jumunjin sand and glass beads. In Fig. 3, the values of K
0
for
the dense sand (DS) are compared with those for glass beads
(GB) according to the vertical stress. The lower values of K
0
for
the dense sand are manifest presumably due to the angularity
effect. The particle surface roughness effect on K
0
values can
be analyzed by comparing the test results from glass beads (GB)
and etched glass beads (EGB). No marked difference of K
0
between GB and EGB is observed during loading, while GB
exhibits higher K
0
values during unloading and reloading. The
ratio between the artificially created surface dents (e.g., ~5 to 10
m) and particle diameter ranges from 0.01 to 0.02 for EGB,
which impose insignificant impact on K
0
during loading, while
the particle geometry is predominant.
4.2
Correlation to Strength
The shear strength of granular materials can be described using
different definitions of friction angle. The critical state friction
angle
c
, the peak friction angle
p
, and dilatancy angle
are
the typical examples. The inter-particle surface friction angle
s
can be regarded as another type of friction angle that contributes
to the overall shear strength of granular materials.
The confining stress within the specimen for the thin-wall
oedometer tests continuously increases upon loading. The
changes in confining stress result in changes in dilatancy and
thus in the peak friction angle. Following Bolton (1986), the
effect of confining stress and relative density on the peak
friction angle can be evaluated using the following relationship:
R D c
p
I R
(5)
where R
D
= dilatancy ratio = 3 and 5 for triaxial and plane-strain
conditions, respectively. The dilatancy index I
R
is defined as:
R
p
Q I
I
A
pm
D R
100
ln
(6)
where I
D
= relative density as a number between 0 and 1; p
A
=
reference stress = 100 kPa;
pm
= mean effective stress at peak
in the same unit as p
A
; and Q and R = intrinsic soil variables.
(a)
(b)
(c)
(d)
Fig. 4 Measured and calculated K0 values with
v
for (a) loose sand;
(b) dense sand; (c) medium etched glass beads; and (d) dense etched
glass beads.
GB, Dr = 56%
Measured
GB, Dr = 80%
Measured


