387
Technical Committee 101 - Session II /
Comité technique 101 - Session II
0
1
2
3
4
5
x 10
-3
-4
-3
-2
-1
0
1
2
3
4
x 10
-4
Time, seconds
Amplitude, volts
0
4
8
12
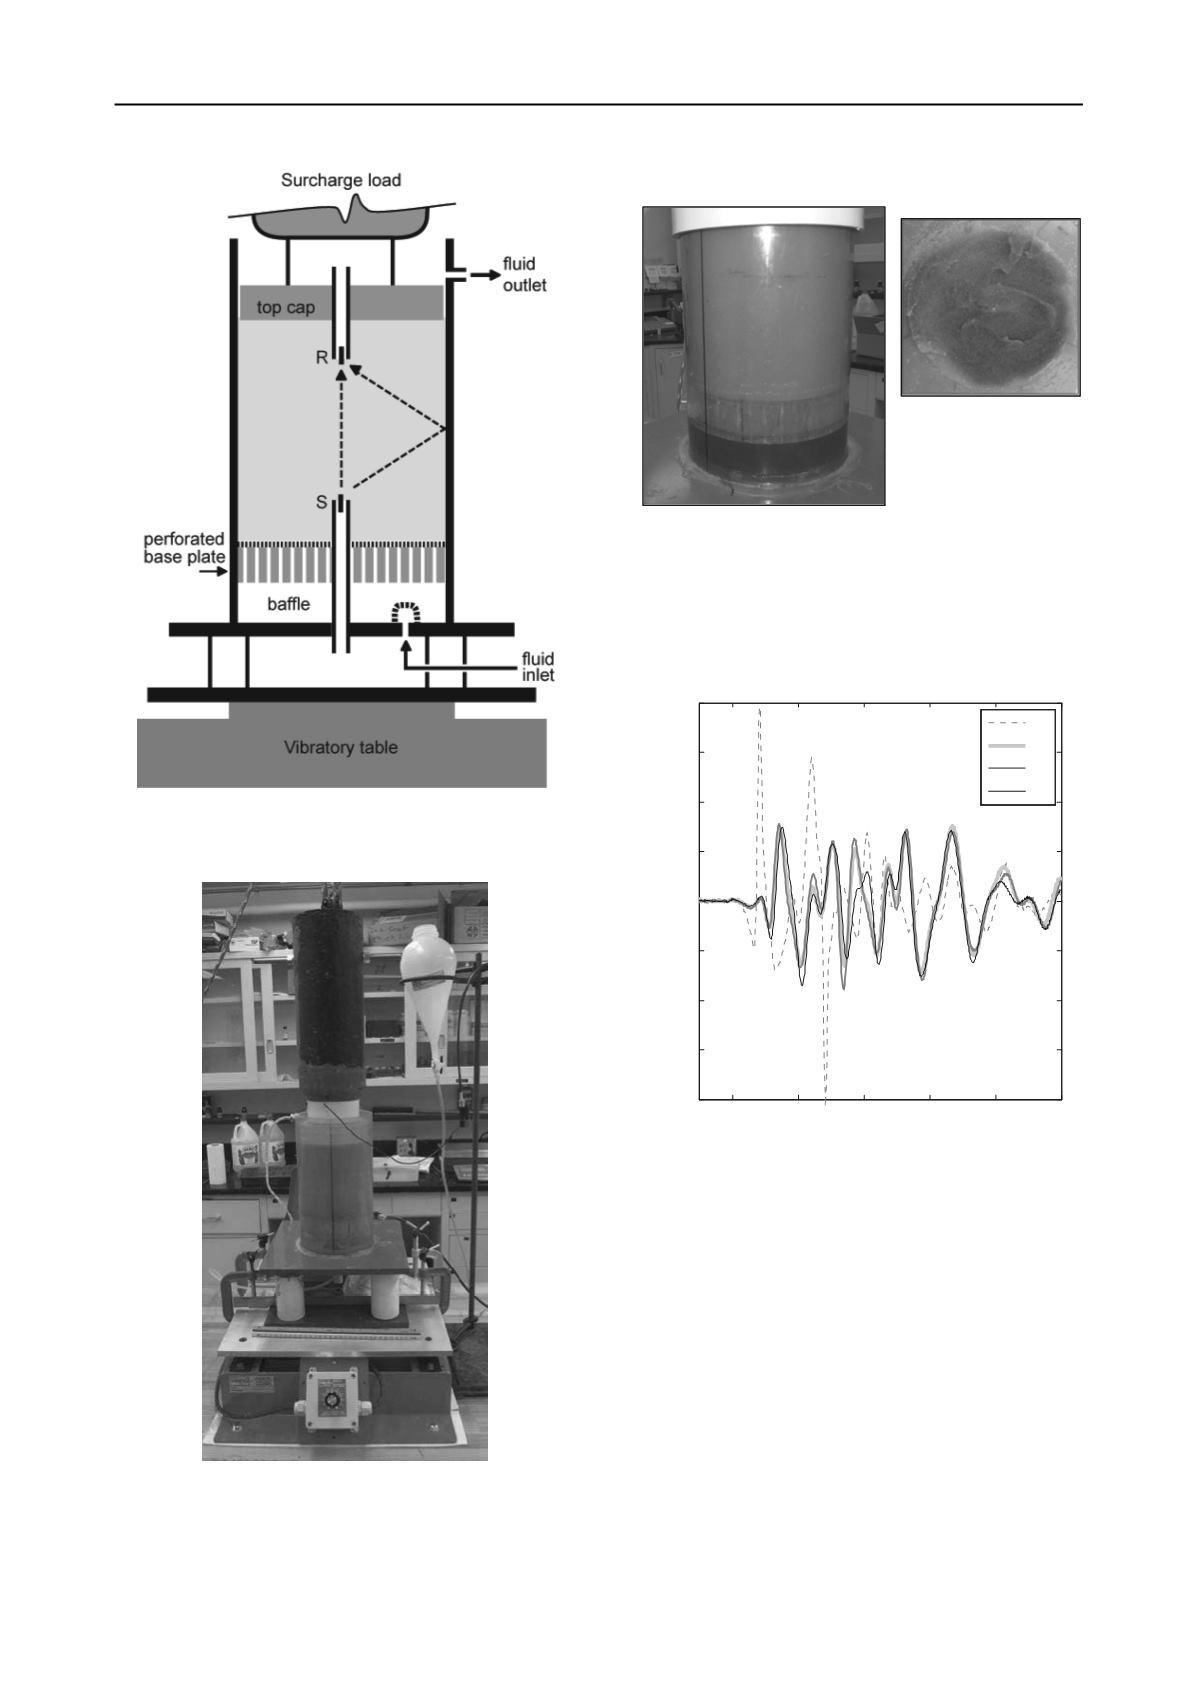
Figure 1. Schematic cross section of test cell. S, R: source and
receiver bender elements, respectively. Direct-transmission S-
wave path and reflected P-wave path are shown.
Figure 2. Photo of test cell and ancillary apparatus. Test cell is
in center, situated on vibratory table. Surcharge mass is
suspended from above. Reservoir for gravity feed of fluid
appears as white container in the upper right of the photo.
Figure 3. Dye test demonstrates uniformity of distribution of
influent. Left: View of column from side. Fluid-filled baffle
zone is indicated by dark shade at bottom; just above is
perforated base plate. Dye appears to be distributed evenly
throughout the sample. Right: View from above of glass beads
inside test cell during disassembly.
Figure 4. Results of first test: baseline. Legend refers to
volume of DI water flushed through the specimen before
testing, in liters.


