397
Technical Committee 101 - Session II /
Comité technique 101 - Session II
Figure 9 shows that presence of damages such as block and
transverse cracking (mostly caused by tree roots) strongly affect
the measurement resulting deflection values lower than average.
The Benkelman beam technique is more susceptible to this cause.
Figure 10. Typical deflection basin on areas with asphalt patching
interventions
Figure 11.Typical deflection basin on areas with presence of
longitudinal cracks
Figure 9.Deflection basin on areas affected by block cracking
In areas intervened with asphalt patching also the curve tends
to be shallower than the average (Figure 10). In contrast, Figure
11 shows that on areas with longitudinal failuresthe deflection
measurements resulted be higher than average, over 0.8 mm. The
presence of other type of damage or drainage structures also
caused high deflection measurements, over 1 mm.
5.2
Maximum deflection value(D
0
)
The pavement structure of the test roads has an asphalt layer
thickness of 100 mm on average, according to Table 1 the
permissible maximum deflection value corresponds to 42,5 mm
-2
.
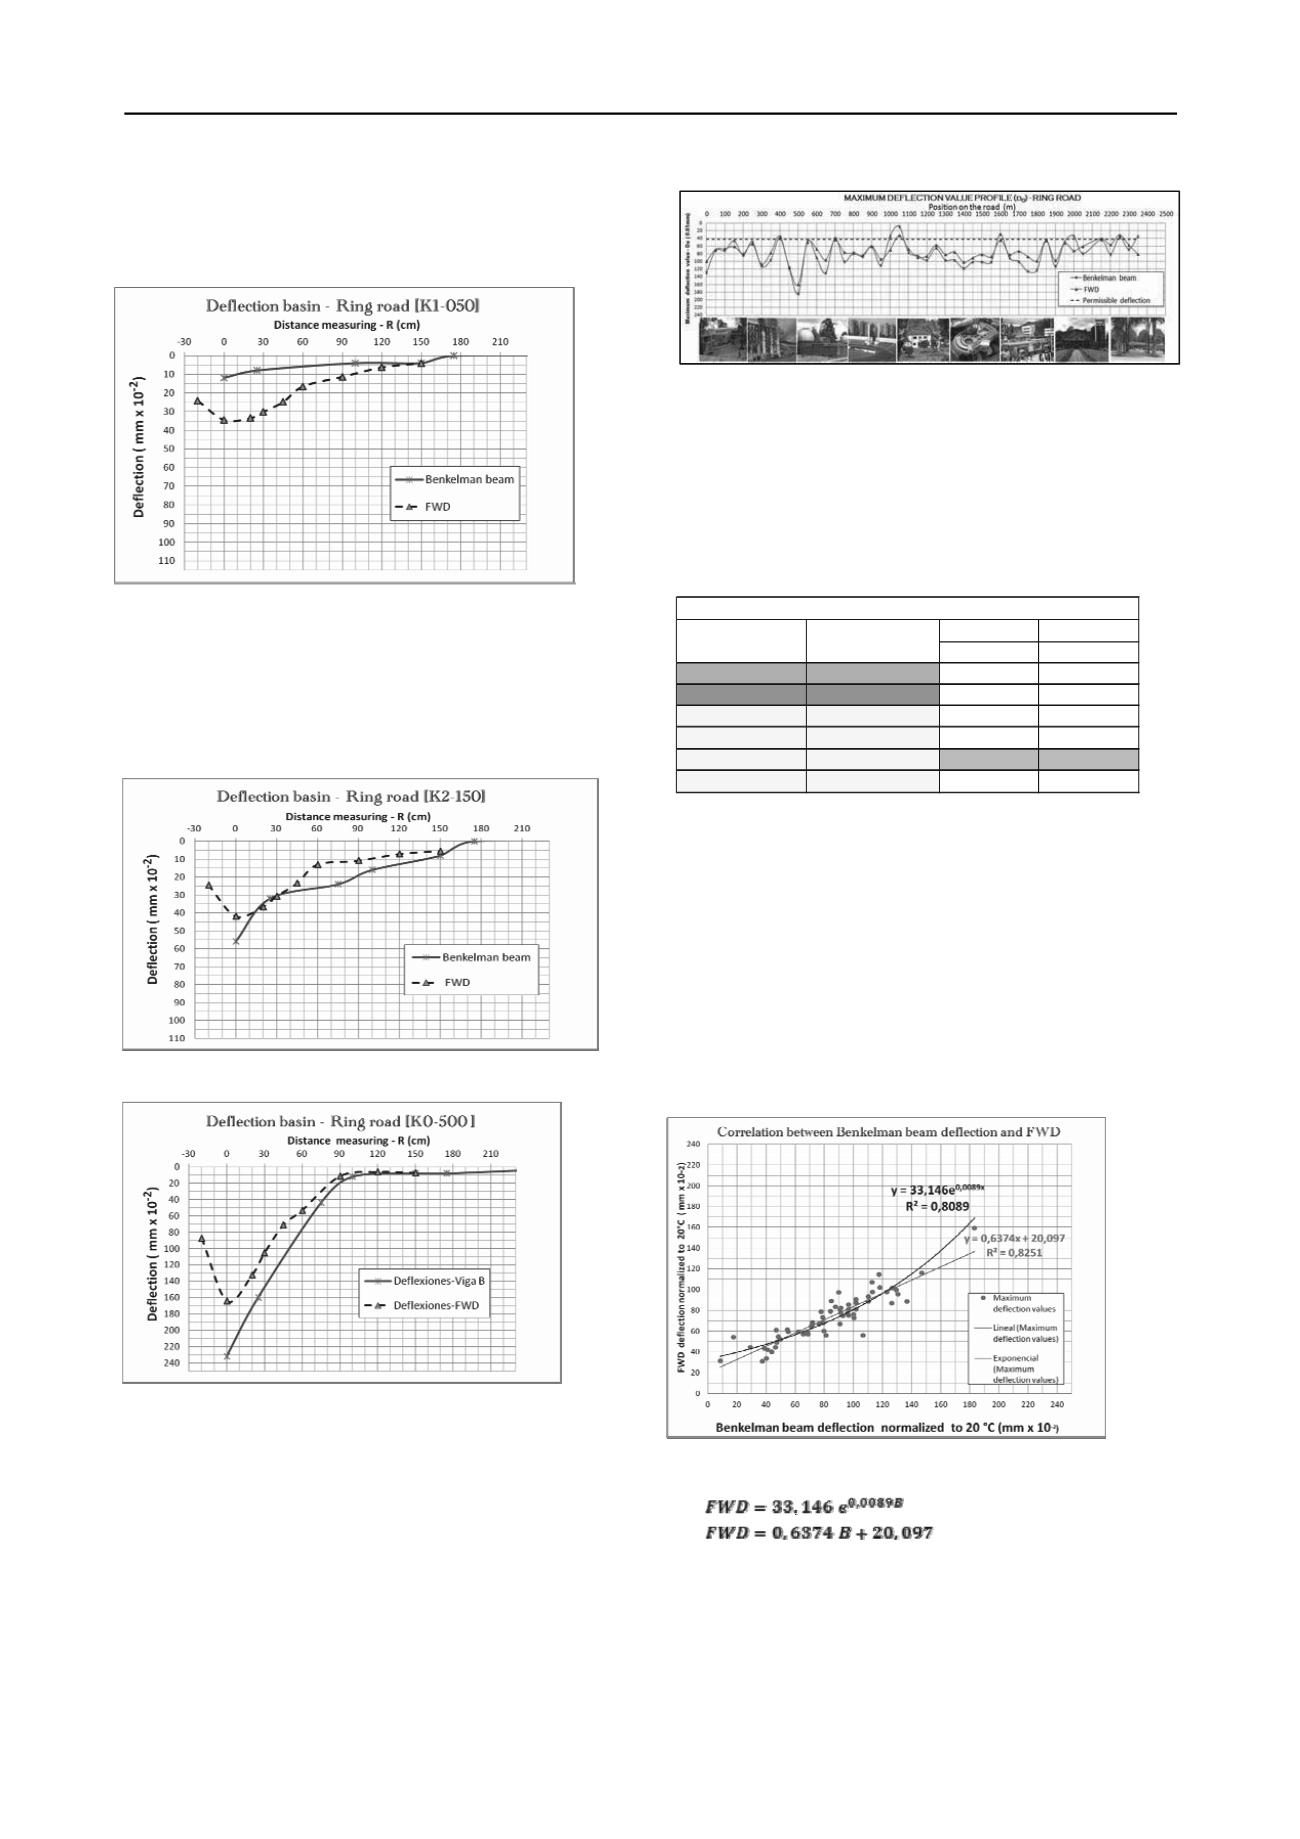
Figure 14 shows the maximum deflectionprofile in the Ring road
and the permissible value.
Figure 12 clearly shows deflections obtained from both devices
follow the same trend. Both deflection profiles obtained using the
Benkelman and FWD are outside the range of the maximum
allowable deflection. The deflection values furthest from the trend
correspond to test points affected by transverse cracking (usually
caused by tree roots), mainly those measurements values obtained
with the Benkelman beam.
The average of maximum deflection values (Do) is around 0.8
mm, which means a pavement structure of low stiffness and sub-
grade of low-bearing capacity. As shown in Table 4, the section in
best condition is the Ring road [K1+800 – K2+350].
5.3
Comparison between Benkelman beam and FWD
measurements
The correlation between the deflection data obtained from FWD
and Benkelman beam is shown in Figure 15. Equations (3) and (4)
were obtained in order to convert Benkelman beam deflections to
FWD deflections taking into account falling weight
deflectometers simulate better the real effects made by moving
loads.
.... (3)
…. (4)
where FWD: maximum deflection value (Do) obtained fromFWD
normalized to a standard temperature of 20°C (68°F), B =
Figure 12. Maximum deflection value profile (d
0
) - Ring road.
Table 4. Maximum deflection - average per section
Figure 12. Correlation between deflections obtained with Benkelman
beam and FWD
Benkel. Beam FWD
0,01mm 0,01mm
Acceso Cl 53 [K0+000 ‐ K0+480]
78.46
72.43
Acceso Trans. 40 [K0+000 ‐ K0+280]
96.44
77.50
Anillo vial
[K0+600 ‐ K1+150]
78.96
71.40
Anillo vial
[K1+200 ‐ K1+750]
93.85
78.93
Anillo vial
[K1+800 ‐ K2+350]
71.53
59.55
Anillo vial
[K0+000 ‐ K0+550]
87.54
81.02
MAXIMUMDEFLECTION NORMALIZED TO 20
O
C
Position on the road
SECTION


