406
Proceedings of the 18
th
International Conference on Soil Mechanics and Geotechnical Engineering, Paris 2013
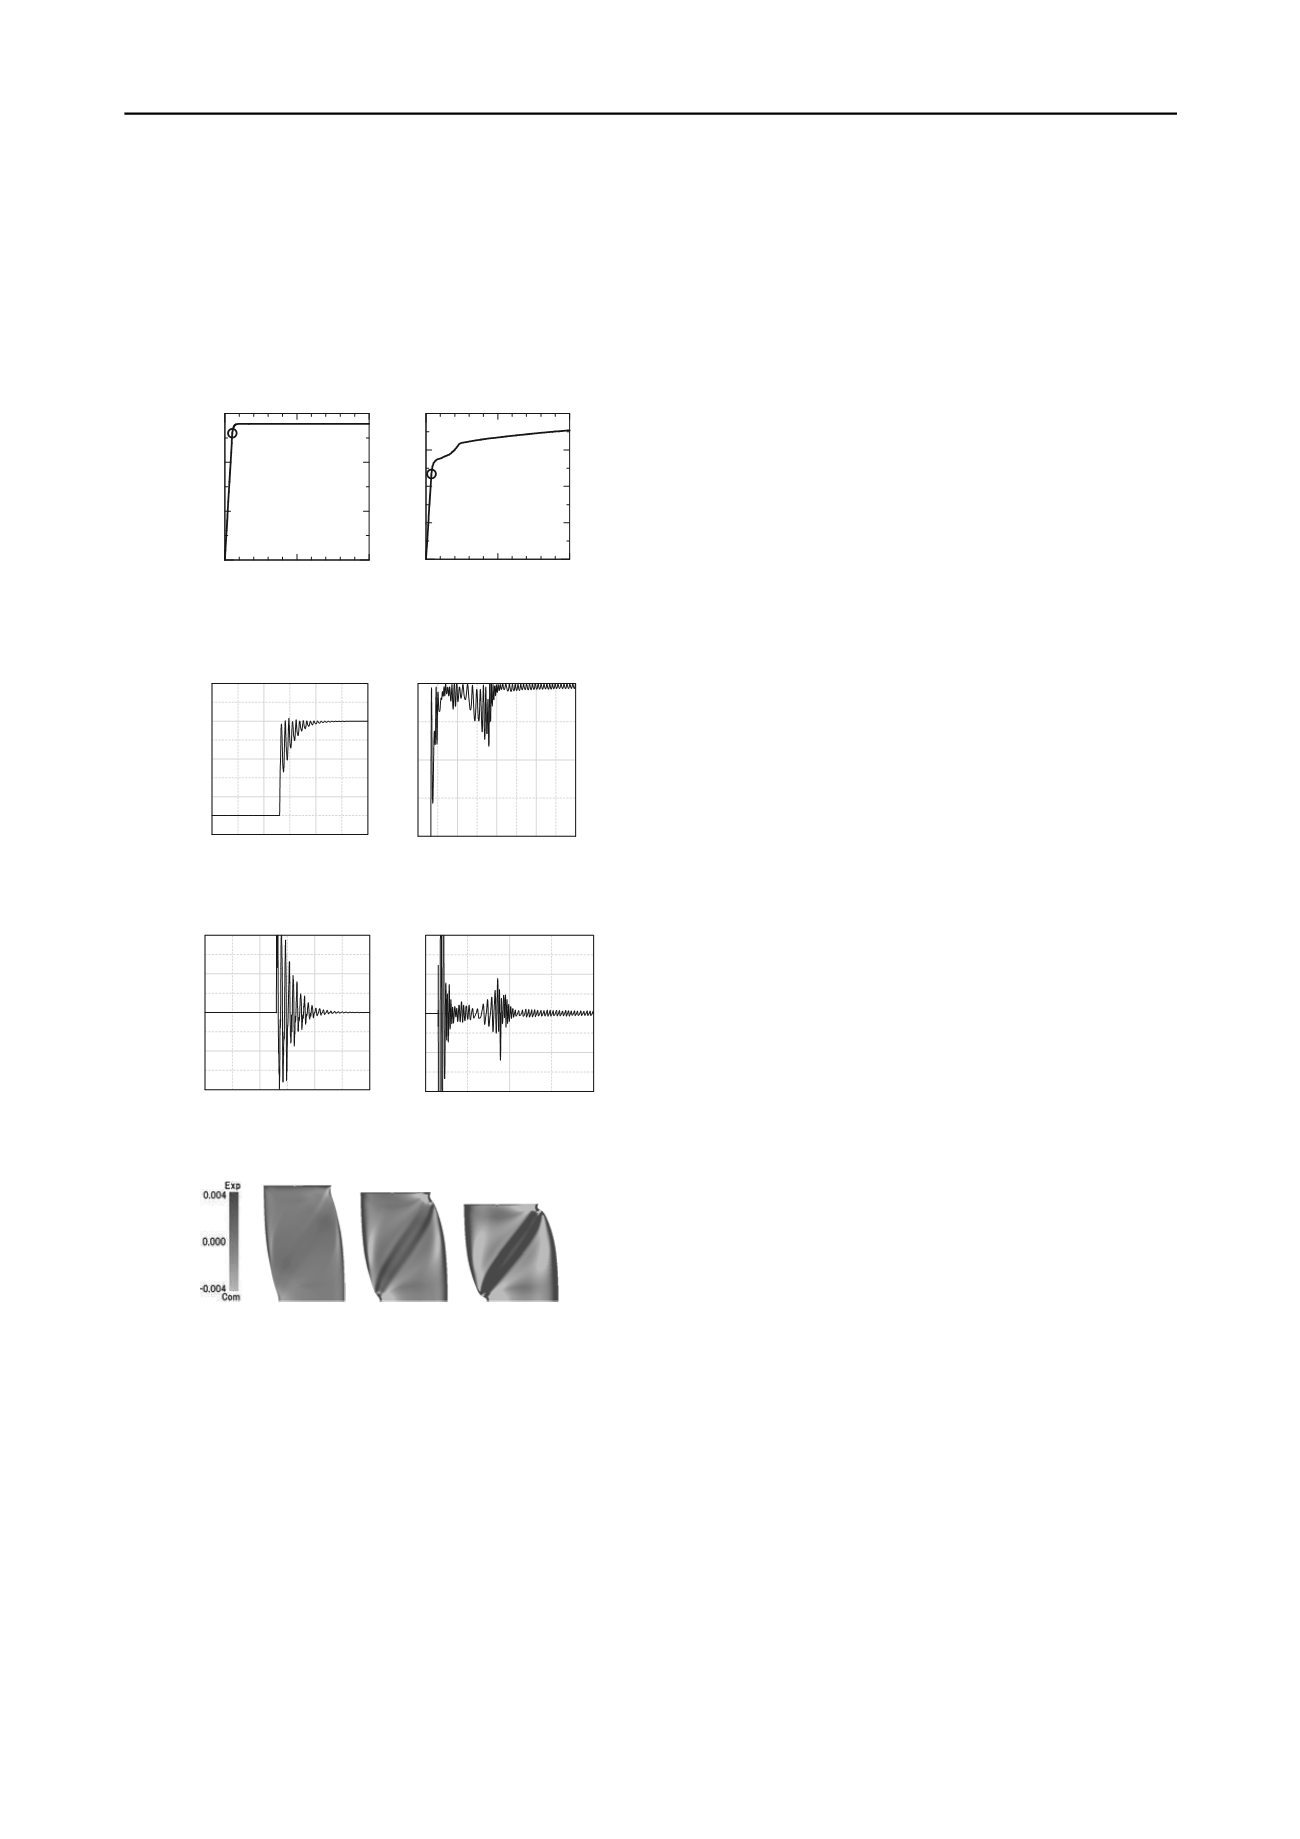
change to load control. Figs. 12 and 13 show the vertical
component of the velocity and acceleration, respectively, of the
top of the specimen (in both cases, upwards is positive). In the
case of both (i) and (ii), immediately after the change to load
control, large changes in acceleration were seen, but in the case
of (i), the changes soon converged. In contrast, in the case of
(ii), after temporarily converging, the vertical velocity increased
at around 0.5 sec to 0.9 sec in association with an increment in
ac-
0
1
2
5
10
15
Time (sec)
Axial strain
a
(%)
0
2
4
16
32
Time (sec)
Axial strain
a
(%)
(i) 13%
(ii) 18.75%
Fig. 11 Development of axial strain; ((i) and (ii) are the axial strain after
changing to load control from displacement control)
0
0.08 0.16 0.24
–12
–8
–4
0
4
Time(sec)
Velocity (cm/s)
0 0.5 1 1.5 2
–4
–2
0
Time(sec)
Velocity (cm/s)
(i) 13%
(ii) 18.75%
Fig. 12 Relationship between vertical velocity of the top and time
0
0.08
0.16
0.24
–3000
–1500
0
1500
3000
Time(sec)
Acceleration(gal)
0
1
2
–400
–200
0
200
400
Time(sec)
Acceleration(gal)
(i) 13%
(ii) 18.75%
Fig. 13 Relationship between vertical acceleration of the top and time
10% 28% 30%
Fig. 14 Changes in specific volume (swelling shear bands)
celeration and then reduced again, and thereafter, the axial
strain slowly increased. In order to show the state occurring
within the specimen at this time, Fig. 14 shows the change in
specific volume within the specimen from the initial state.
During the displacement control that included
a
=10%, the
loading was comparatively fast, so there was almost no
migration of pore water within the specimen; however, under
load control with the load constant, migration of pore water
proceeded, causing flow into the shear band and swelling
(generating swelling bands and acceleration).
7 CONCLUSION
This paper describes examples of calculation using the
dynamic/static soil-water coupled finite deformation analysis
code, GEOASIA in accordance with the
u
-
p
Formulation on the
plane strain rectangular overconsolidated specimen under
constant cell pressure and undrained conditions. The following
is a summary of the new knowledge obtained:
1) Firstly, it was shown that a uniform deformation field in
saturated soil under element-wise undrained conditions is
possible when the permeability coefficient is zero, and that the
output acceleration and pore water pressure field are in virtual
agreement with the theoretical values. In order to realize this, it
is necessary to apply a distribution of initially reduced velocities
and accelerations, as well as pore water pressure within the
specimen derived from theoretical considerations.
2) Next, initial velocity, acceleration, and pore water
pressure values of zero were applied, and under vertical
displacement control, vertical rates were applied with
symmetric compression loading from the top and bottom. In this
case, the lateral and vertical symmetry of the specimen broke
down, and strain localization occurred. Also, in association with
the occurrence of shear banding, when a vertical rate of 5 cm/s
was applied, accelerations with a maximum of slightly less than
2000 gal were generated from the shear band with a
predominant period of around 5.0×10
-3
sec.
3) The load rate effect was investigated thirdly. The results
showed that although the magnitudes of the Fourier amplitudes
of the generated accelerations were different, the predominant
period in all cases was unchanged at around 5.0×10
-3
sec.
Together with 2), in dynamic analyses, even though an
acceleration time history such as input seismic motions, etc., has
been applied to specimens or the ground, the point of view of
generation of accelerations during the deformation of the soil or
the ground itself has almost never been emphasized.
4) Finally, the specimen exhibited creep behavior under
undrained conditions when the displacement control in 2) was
changed to load control after the basic path deviated, and the
load was maintained constant. When the load was held constant
at a more unstable position, the axial displacement increased
greatly with increases and decreases in acceleration in
association with the development of shear bands associated with
swelling (swelling bands). In this calculation, the inherent clay
concept of the soil structure was not introduced, but it was
shown that due to the existence of the inertia term and soil-
water coupled behavior, large deformation associated with time
dependence under load instability can be easily simulated.
8 REFERENCES
Ikeda, K. et al. 2003. Simulation and interpretation of diffuse mode bifurcation of
elastoplastic solids,
J. Mech. Phys. Solids
51 (9), 1649–1673.
Wan, R.G. et al. 1990. A Finite Element Method for the Analysis of Shear Bands
in Geomaterials,
Finite Elem Anal Des
7 (2), 129-143.
Asaoka, A. et al. 2007. All soils all states all round geo-analysis integration,
Implementation, Evaluation, and Application
, Hong Kong, China, 11-27.
Noda, T. et al. 2008. Soil-water coupled finite deformation analysis based on a
rate-type equation of motion incorporating the SYS Cam-clay model,
S&F
48
(6), 771-790.
Asaoka, A. et al. 2002. An elasto-plastic description of two distinct volume
change mechanisms of soils,
S&F
42 (5), 47-57.
Asaoka, A. et al. 1994. Imperfection-sensitive bifurcation of Cam-clay under
plane strain compression with undrained boundaries,
S&F
35 (1), 83-100.
Noda, T. et al. 2013. Realization of uniform deformation of soil specimen based
on soil-water coupled finite deformation analysis considering inertia forces,
S&F
, to be submitted.
Asaoka, A. et al. 1998. Displacement/traction boundary conditions represented by
constraint conditions on velocity field of soil,
S&F
38 (4), 173-181.


