408
Proceedings of the 18
th
International Conference on Soil Mechanics and Geotechnical Engineering, Paris 2013
(a)
(b)
(c)
Figure 1. Places from where the soils were sampled. (a) Silt (ML); (b)
Sand (SM); and (c) Clay, CH.
The index properties of the soils are listed in Table 1 and the
compaction characteristics obtained from Proctor and modified
tests are summarized in Table 2 (Figure 2 a 4).
Table 1.Index properties of the test soils.
Atterberg limits
Soil
Type LL (%) PL (%) PI (%)
% passing 200
sieve (%)
G
s
CH 66
25
41
85.7
2.61
ML 44
33
11
87.0
2.56
SM NP
NP
NP
37.0
2.52
Table 2.Compaction characteristics.
Standard effort (ASTM
D698)
Modified effort (ASTM D
1557)
Soil type
w
opt
(%)
dmax
(kN/m
3
)
w
opt
(%)
dmax
(kN/m
3
)
CH
30.0
13.32
---
---
ML
30.5
13.33
24.5
14.59
SM
23.54
14.04
19.0
15.17
12.2
12.4
12.6
12.8
13.0
13.2
13.4
20 22 24 26 28 30 32 34 36 38 40
Dry unit weight (kN/m
3
)
Water content (%)
Proctor standard
CH Soil
Sr = 100%
G
s
= 2.61
w
opt
=
30 %
dmax
=
13.32 kN/m
3
Figure 2.Compaction curve of the CH soil.
12.0
12.4
12.8
13.2
13.6
14.0
14.4
14.8
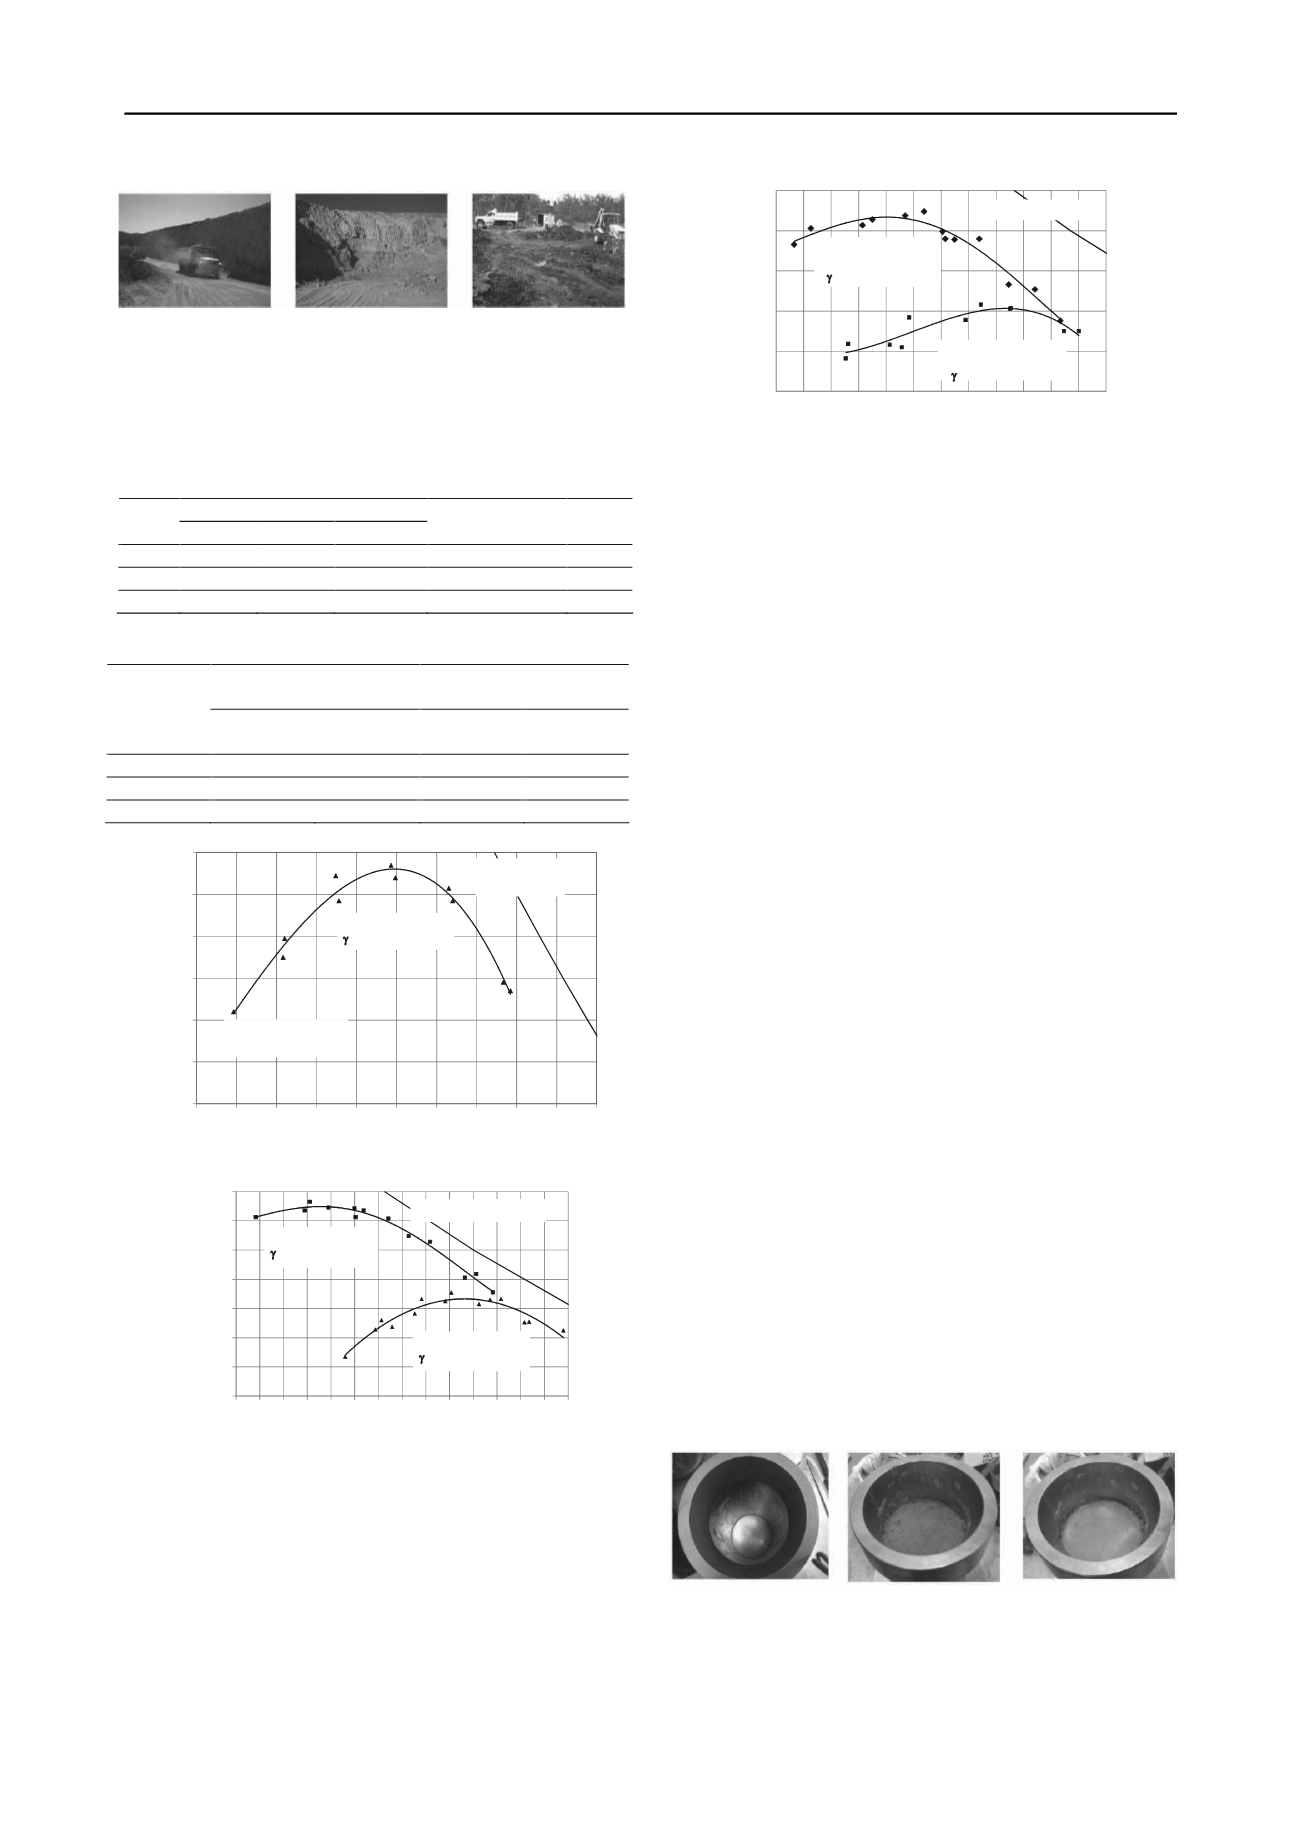
21 22 23 24 25 26 27 28 29 30 31 32 33 34 35
Dry unit weight (kN/m
3
)
Water content (%)
S
r
= 100 %; G
s
= 2.56
w
opt
= 24.5 %
dmax
= 14.59 kN/m
3
w
opt
= 30.5 %
dmax
= 13.33 kN/m
3
Figure 3. Compaction curves of the ML soil.
13.0
13.5
14.0
14.5
15.0
15.5
15 16 17 18 19 20 21 22 23 24 25 26 27
Water content (%)
Dry unit weight (kN/m
3
)
Modified
w
opt
= 19 %
dmax
= 15.17 kN/m
3
Proctor standard
w
opt
= 23.54 %
dmax
= 14.04 kN/m
3
S
r
= 100 %; G
s
= 2.52
Figure 4. Compaction curves of the SM soil.
4 TEST PROCEDURES.
4.1 Compaction curves. Proctor standard and modified
(ASTM D698 and ASTM D 1557)
To obtain the standard and modified compaction curves, the
ASTM procedures were followed (ASTM D698 and ASTM
D1557). From these procecdures, the method A was utilized in
both cases since all material tested passed sieve number 4.
4.2 Compaction curves. Gyratory compactor
As was mentioned in previous paragraphs, in this equipment the
operator can control variables such as: vertical pressure, angle
of gyration, height of specimen, density, etc. In this study, the
controlled variables were as follows:
Vertical pressure: 200, 300, 400, 500, and 600 kPa.
Angle of gyration: 1 and 1.25 degrees
Number of gyrations: 500
Rate of gyrations: 10, 20 and 30 gyrations/min
Soil type: 3
Mass of compacted soil: 2300 g
Once the soils were gathered, the material larger than No. 4
sieve was discarded. The material passing was allowed to dry at
environmental conditions and subsequently itwas mixed
throughly and then stored in sacks.
For all three soils, the procedure followed to evaluate the
compaction curves was as follows:
1. 180 soil samples of 2300 g of dry soil (of each soil type)
were weighted so that to cover all the combinations of
the variables to be controlled (5 vertical pressures x 2
angles of gyration x 3 rates of gyration x 1 sample at
each point x 6 points on the compaction curve).
2. Different amounts of water were added to each sample
so that to cover the range in which the modified and
standard tests were found (to develop each curve, six
points were considered).
3. The soil samples were stored during 24 hours.
4. An amount of 2300 g of wet soil was placed inside the
compaction mold (Figure 5b and 5c), but previously
some plastic strips were placed on the interior wall of
the mold so that the soil did not stick and the sample
could be extracted (Figura 5a). In addition, another
plastic circle was placed on top of the soil so that it did
not stick against the top compaction platen.
(a)
(b)
(c)
Figure 5.(a) Strips inside the interior wall of the mold; (b) 2300g of wet
soil were placed in the mold, and, (c) A plasticcirclewas placed on top
of the mold for the soil not to stick to the compaction platen.


