416
Proceedings of the 18
th
International Conference on Soil Mechanics and Geotechnical Engineering, Paris 2013
Proceedings of the 18
th
International Conference on Soil Mechanics and Geotechnical Engineering, Paris 2013
hydraulic heave safety with surcharge filters. Preliminary they
did their calculations according to Terzaghi/Peck’s and
Baumgart/Davidenkoff’s approach and developed a functional
relation between t/
h and d
F
/
h (t: embedment depth of the pit
wall; d
F
: thickness of the surcharge filter;
h: potential
difference). A ratio of
F
/
W
= 1.0 (
F
: unit weight of the
surcharge filter material;
W
: unit weight of water) and
S
’/
W
= 1.0 (
S
’: buoyant unit weight of the soil) was assumed.
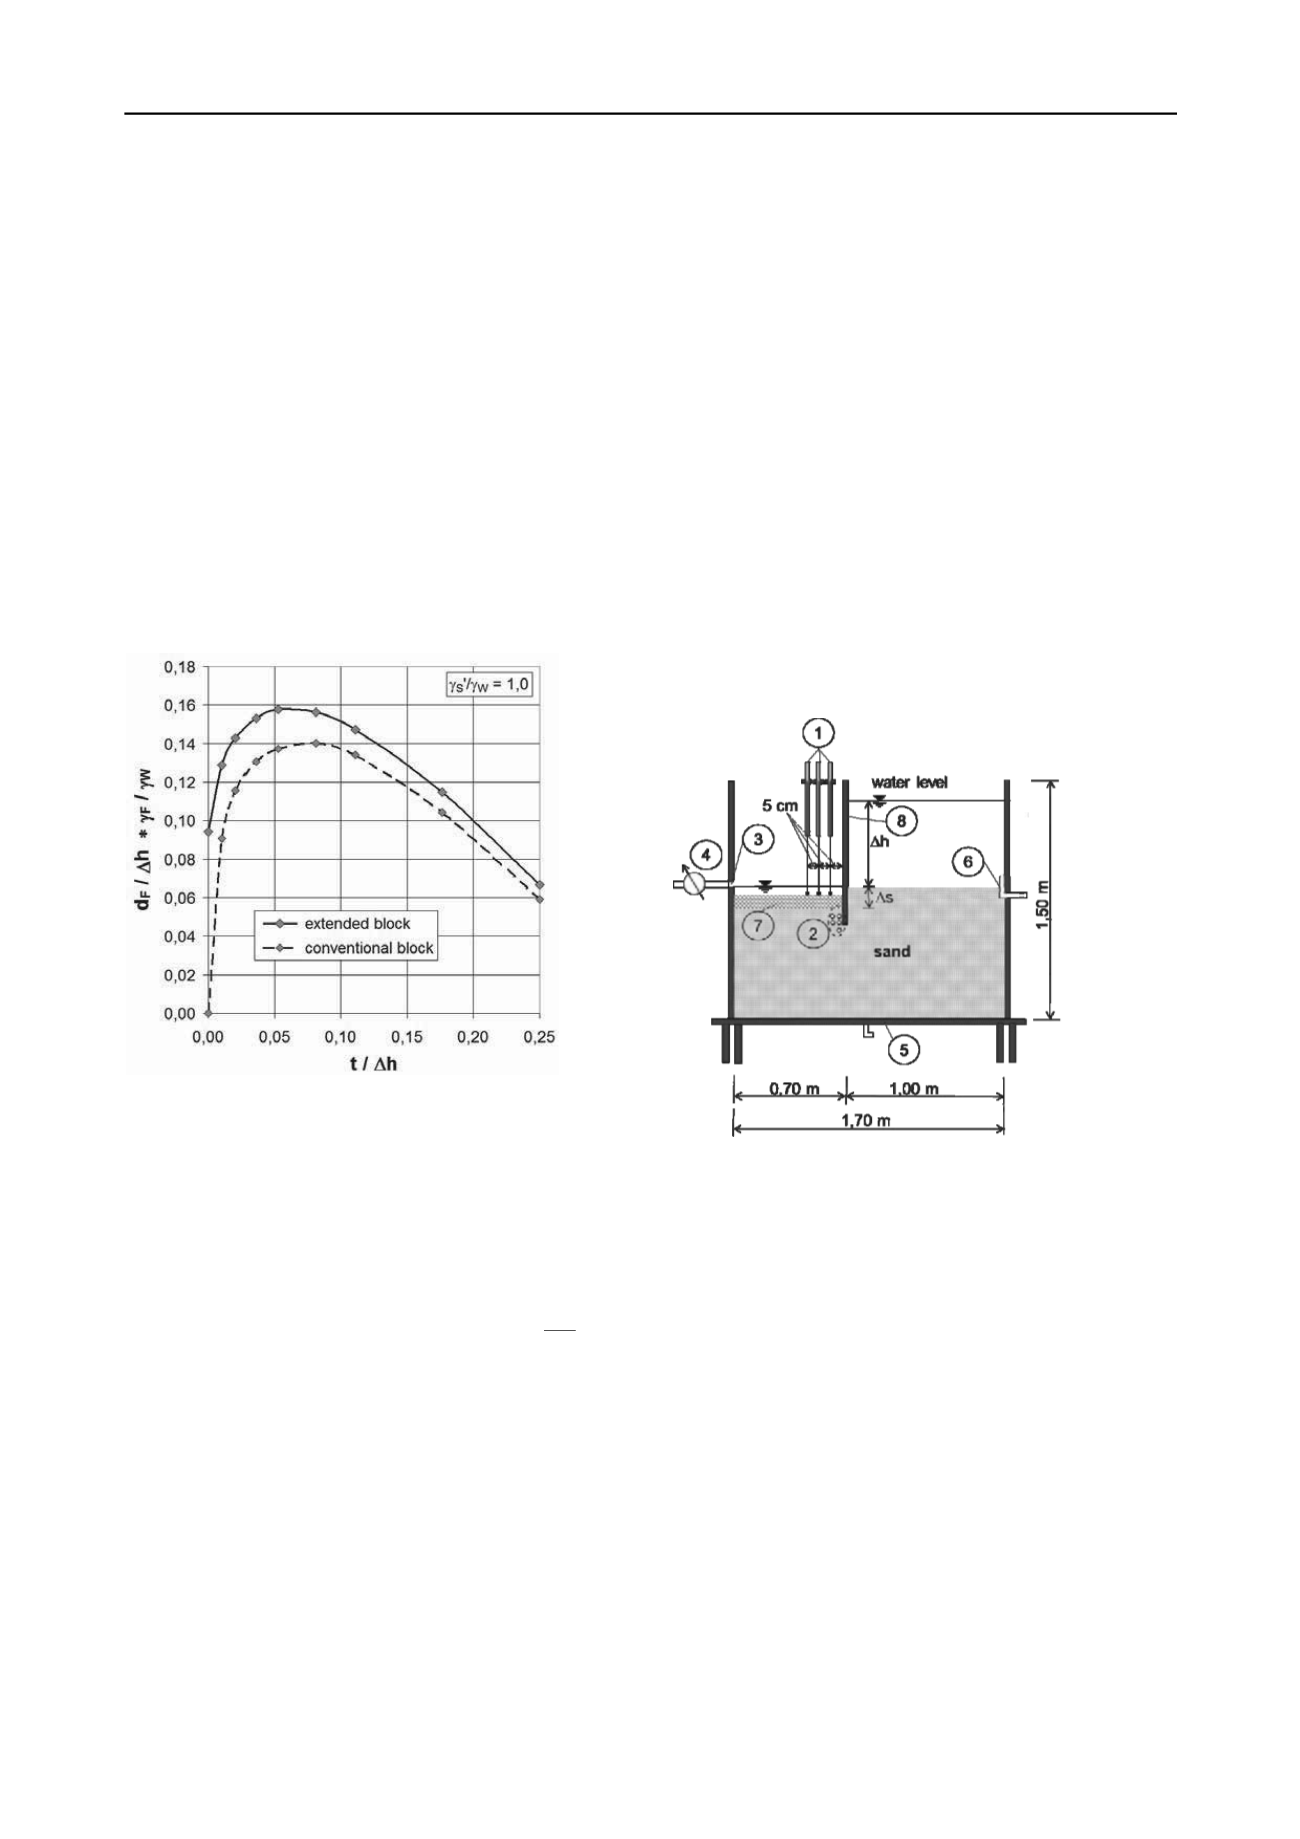
The functional relation is illustrated in Figure 2 (dashed line) for
the
conventional
unstable
block
according
to
Baumgart/Davidenkoff’s approach.
As expected, the required filter thickness initially rises with
constant potential difference
h and decreasing embedment
depth t. However, after reaching a maximum the necessary filter
thickness d
F
decreases with constant potential difference
h and
continuously decreasing embedment depth t down to zero.
Hence, an unstable block that only reaches to the wall toe is
inadequate to verify the hydraulic heave safety if a surcharge
filter is installed and the embedment depth of the pit wall is
small (Odenwald and Herten 2008).
Figure 2. Required thickness of the surcharge filter d
F
(Odenwald and Herten 2008)
Therefore, Odenwald and Herten developed an unstable
block which additionally considers the vertical flow forces
below the wall toe. Hence, the unstable block according to
Davidenkoff was extended to the depth where the specific
hydraulic gradient i
z
(vertical hydraulic gradient) and the
limiting gradient i
gr
(hydraulic gradient corresponding to the
ratio
S
’/
W
) have the same value (i
z
= i
gr
).
Figure 2 (solid line) also shows the results of the
computation with the extended unstable block also as a
functional relation between t/
h and d
F
/
h. However, a
maximum is also reached here, which means that with constant
potential difference
h, a further reduction of the embedment
depth t requires a smaller thickness of the surcharge filter d
F
.
To verify the results of the numerical approach with the
extended unstable block, numerous large scaled laboratory
experiments were performed.
3 SIMULATION OF HYDRAULIC HEAVE
In order to verify and improve these theories, several large-
scale experiments to simulate hydraulic heave with a low
embedment depth t and installed surcharge filter were carried
out at the Institute of Soil Mechanics and Foundation
Engineering of the Bundeswehr Universität München. In these
experiments, the embedment depth as well as the thickness of
the surcharge filter was varied. The aim of the experiments was
to appoint the critical potential difference
h
crit
as a function of
the embedment depth t and the surcharge filter thickness d
F
.
The test rig (Figure 3) consists of two parts: the water
supply, which is used to increase the potential difference
continuously, and the test box. The rectangular test box has the
following dimensions: length x with x height= 1.70 m x 0.40 m
x 1.50 m. It mainly consists of 4 acrylic glass walls, a base plate
and a vertically moveable partition acryl panel in the middle of
the box. The partition wall simulates the retaining wall in the
laboratory test. An inlet connects the box with the water supply.
On the feed stream side of the test box, three, 3 cm in diameter,
pipes allow free drainage.
Sand (as basic material) and a mixture of coarse sand and
fine gravel (as filter material) were used as test materials for the
simulations of hydraulic heave with filter layers at the
excavation side of the wall.
The behavior of the soil during the experiment was
monitored via displacement transducers, water pressure sensors,
water quantity measurement and the Particle Velocimetry
Method (PIV).
A more detailed description of the employed measurement
techniques, the test materials and the construction of the
experimental rig is given in (Schober, Boley and
Odenwald 2011).
Figure 3. Schematic of experimental rig: (1) displacement
transducer, (2) water pressure sensors, (3) outlet, (4) water
meter, (5) base plate, (6) inlet, (7) surcharge filter, (8) partition
panel
Overall, 24 tests were carried out. The embedment depth
was varied between t = 0 cm and t = 5 cm in 0.5 cm and 1.0 cm
steps. Moreover, the surcharge filter was installed in different
sizes, with a thickness of d
F
= 2, 4 and 6 cm.
3.1
Test results
Due to different boundary conditions of the numerical model
(Odenwald and Herten 2008) and the experimental rig (Figure
3), it was not possible to compare the results directly to each
other. Therefore, it was necessary to adapt the theoretical
approach to the boundary conditions of the experiments series.
This was done by numerical calculations with the same
boundary conditions as the experimental model (Schober and
Odenwald 2012).
Figure 4 shows the results of the test series the adapted
numerical calculation as a function relation of t/
s and
h
crit
/
s
(
s: level difference between up and down stream side of the
wall, Figure 3).
From Figure 4 it can be seen that the experimental results
agree qualitatively well with the results of the numerical
calculation. Both the experimentally determined and the


