409
Technical Committee 101 - Session II /
Comité technique 101 - Session II
5. The mold was placed inside the machine (SERVOPAC).
It was programmed to compact the soil at a required
angle of gyration, vertical pressure and 500
gyrations.This step was repeated for the 180 samples of
each soil type.
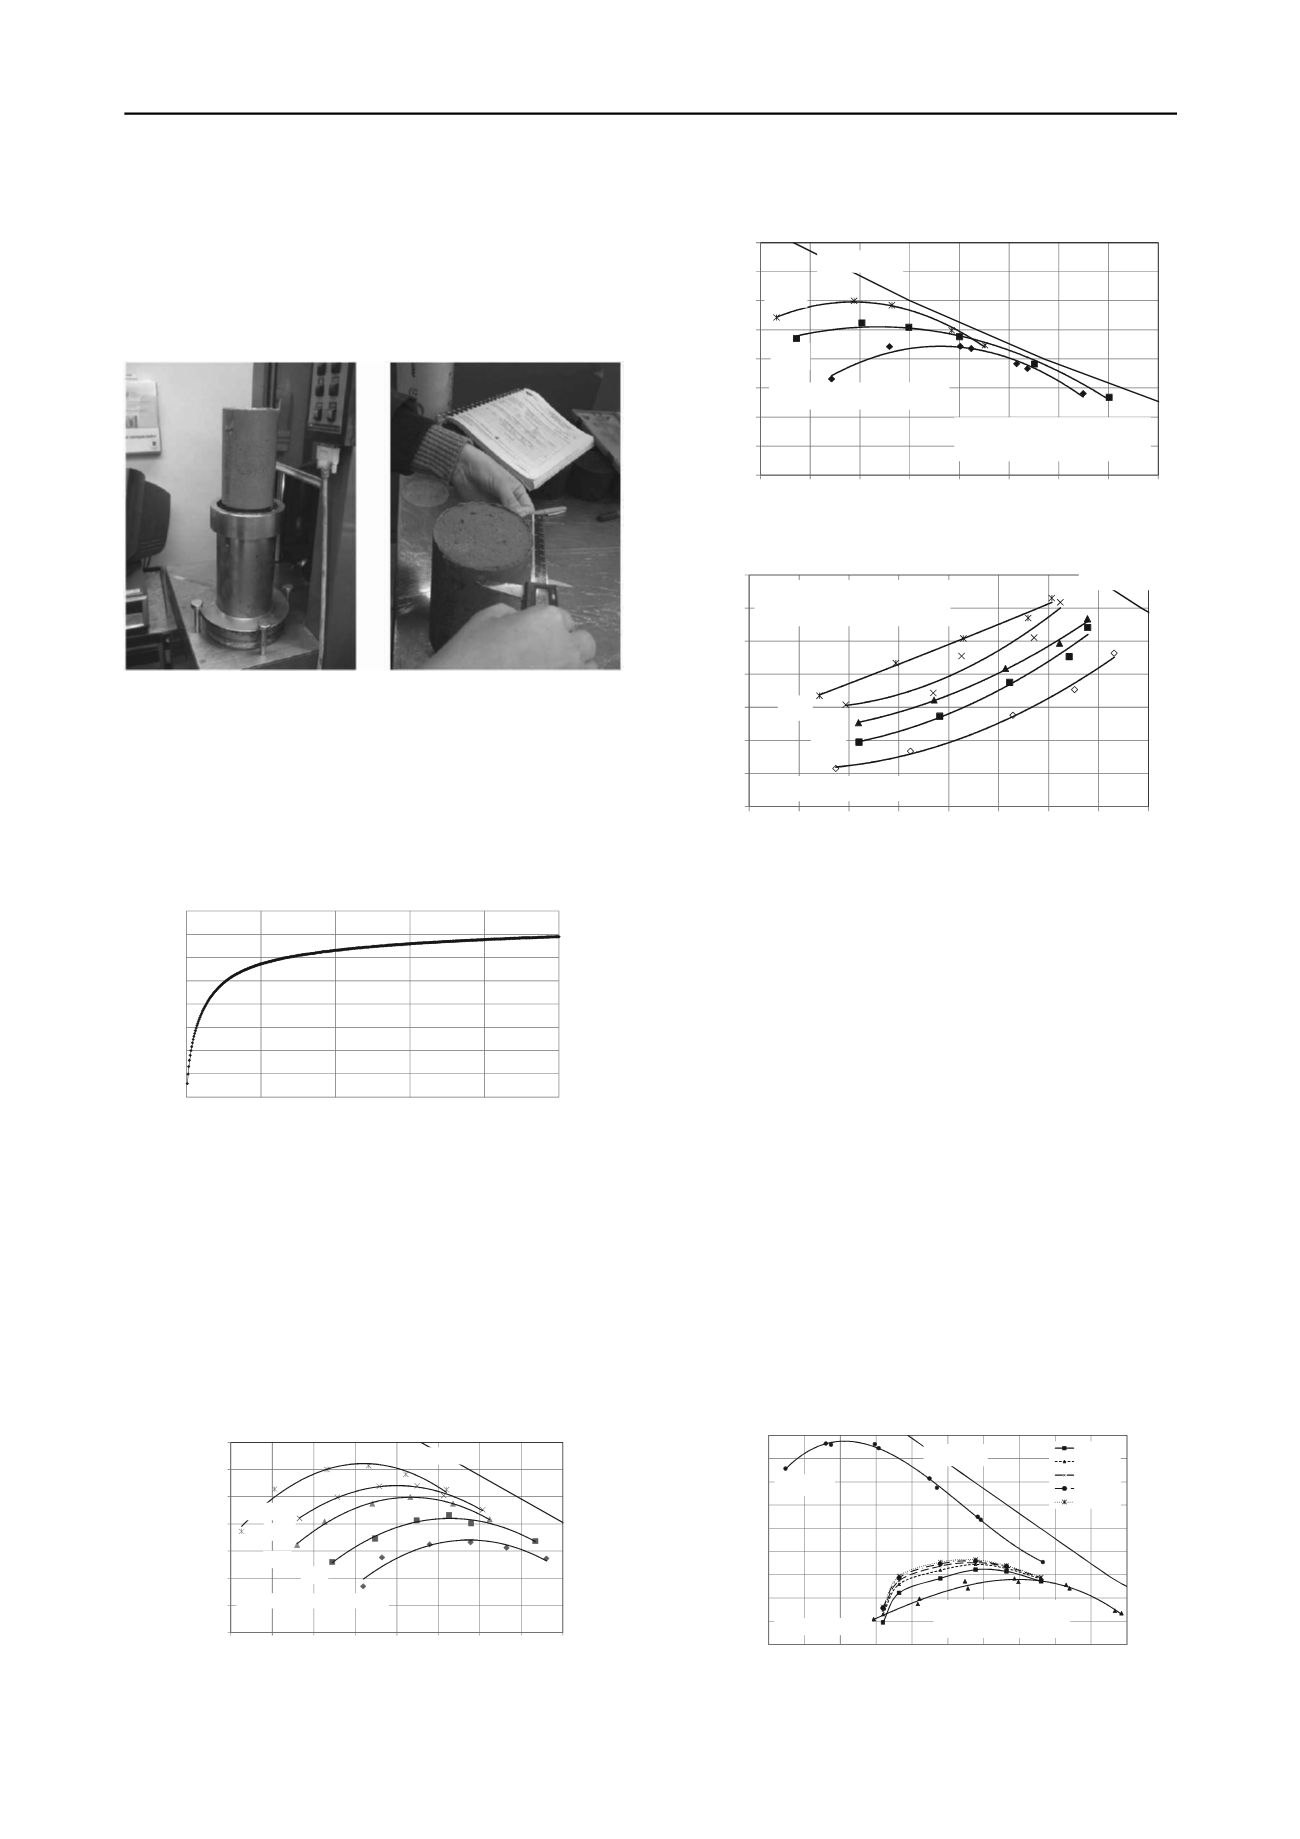
6. After the sample was compacted at 500 gyrations, it was
extracted. The dimensions and weight were taken and
registered.
(a)
(b)
Figure 6.(a) Ejection of the compacted sample; (b) the dimensions of the
sample were taken.
7. In the final step the sample was taken apart to obtain
samples to determine el water content.
8. With data of water conent, height of the specimen and
dimensions, the dry unit weight was calculated at every
gyration. A typical plot obtained for every single
sample is ilustrated in Figure 7.
11.6
11.8
12.0
12.2
12.4
12.6
12.8
13.0
13.2
0
100
200
300
400
500
Dry unit weight (kN/m
3
)
Gyration number
Figure 7.Typical plot of dry unit weight versus gyration number
From Figure 7 data at 100, 200, 300, 400, and 500 gyrations
were taken to plot the compaction curves.
5 DISCUSION OF RESULTS
5.1 Compaction curves from gyratory compactor
Figure 8, 9 and 10 illustrates the compaction curves obtained at
different vertical pressures, 1.25 angle of gyration, 10 gyrations
per minute and for each soil type. The dry unit weight plotted in
these figures was taken at gyration number 500.
12.0
12.5
13.0
13.5
14.0
14.5
15.0
15.5
16
18
20
22
24
26
28
30
32
Dry unit weight (kN/m
3
)
Water content (%)
Vertical pressure = 200 kPa
300
400
500
600
S
r
= 100 %
Figure 8. Compaction curves for CH soil.
11.0
11.5
12.0
12.5
13.0
13.5
14.0
14.5
15.0
25 27 29 31 33 35 37 39 41
Dry unit weight (kN/m
3
)
Water content (%)
Sr = 100 %
Vertical pressure: 200 kPa
300
600
Rate: 10 gyrations/minute
Gyration angle: 1.25 degrees
Figure 9. Compaction curves for ML soil.
12.0
12.5
13.0
13.5
14.0
14.5
15.0
15.5
10 12 14 16 18 20 22 24 26
Dry unit weight (kN/m
3
)
Water content (%)
S
r
= 100 %
Vertical pressure: 200 kPa
300
600
Rate: 10 gyrations/minute
Gyration angle: 1.25 degrees
Figure 10. Compaction curves for SM soil.
As can be noted from Figures 8, 9 and 10, the dry unit weight
increases and the optimum water content is reduced as the
vertical pressure increases, however, this trend is clear for the
CH and ML soil. On the other hand, for the SM soil, the dry
unit weight increases, but for water contents larger than the
optimum of the Proctor standard test, the material cannot be
compacted because water starts to flow out of the mold. For this
reason, the compaction curves do not show the maximum dry
unit weight that can be observed in the standard compaction
curve obtained by impacts.
5.2 Effect of different variables on the compaction curve
5.2.1 Gyration number
In Figures 8 to 10 the value of dry unit weight that was plotted
was calculated at gyration number 500, however, for each
compacted sample, it was obtained a curve of gyration number
versus dry unit weight. Thus, to detect the effect of the number
of gyrations, some of the compaction curves were plotted on the
compaction space together with the standard and modified
curves (Figure 11). As seen from this figure and also from
Figure 7, the mayor change in the dry unit weight is noted in the
first 100 or 200 cycles. For further gyrations, there is only a
slow change in dry unit weight. Thus, it can be concluded that
the soil can be compacted with 100 or 200 gyrations.
12.2
12.6
13.0
13.4
13.8
14.2
14.6
15.0
15.4
15.8
16 18 20 22 24 26 28 30 32 34 36
Dry unit weight (kN/m
3
)
Watercontent (%)
Vertical pressure = 200 kPa
Rate = 10 gyrations/minute
Gyration angle = 1.25 degrees
100 giros
200
300
400
500
Modified
Proctor standard
Sr = 100 %
Figure 11. Effect of number of gyrations on the compaction curve (CH
soil).


