401
Technical Committee 101 - Session II /
Comité technique 101 - Session II
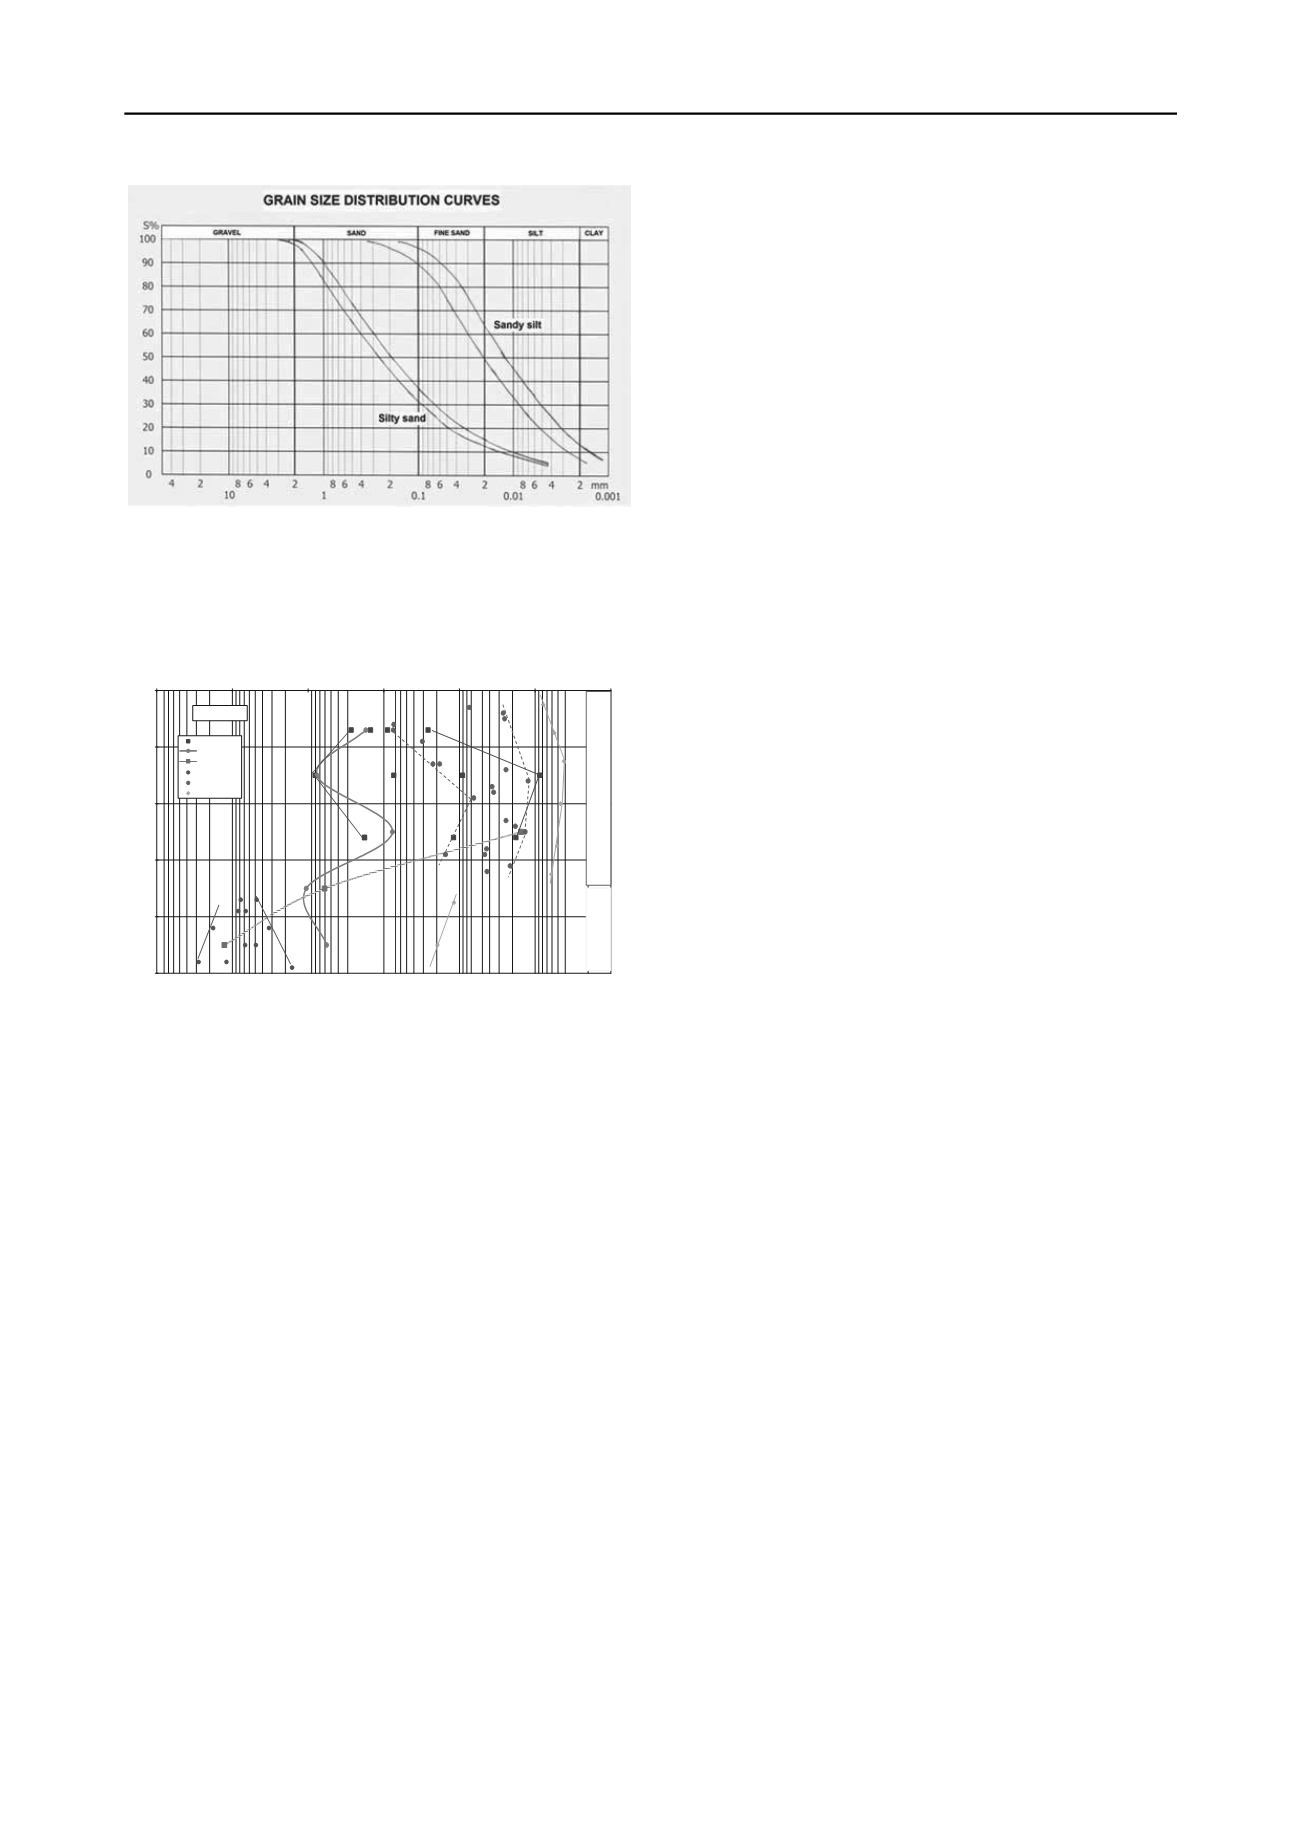
Figure 1. Grain size distribution curve envelopes of the tested soils
4 TEST RESULTS
The results of the performed permeability tests are summarized
in Figure 2.
54+260section
0
1
2
3
4
5
1,00E-08
1,00E-07
1,00E-06
1,00E-05
1,00E-04
1,00E-03
1,00E-02
Coefficientofpermeabilityk (m/s)
depth (m)
water filtration
Menard-probe
Khafagi-probe
constant head test
fallinghead test
Hazen-equatation
Silty fine sand
Fine sandy silt
Groundwater not appeared
Figure 2. Measured permeability coefficients
The following conclusions can be drawn from a practical
comparison of various measurement methods on the basis of
determining the applicability of the methods (see Figure 2).
• The majority of measurement methods identified the change
of soil along the two sides of the formation boundary.
• The results showed higher than expected scatter and the
errors seem to be regular in character and attributable to
the method of measurement.
• Each method is likely to have a relative error of one order of
magnitude, disregarding the examination of samples
taken from the vicinity of the surface.
• The error of water absorption was especially large: three
orders of magnitude at the depth of 1.7 meters and only
two at 2.6 meters. This method seems to lend itself to
erroneous measurements.
• The scope of validity of the test performed with falling
water head test did not cover the bottom layer, as water
flow through the specimen rapidly. As a result
equipment maintaining constant water head test had to
be used to examine the lower layer.
• Regardless of the type of soil, measurements with the
Menard probe returned values varying between k = 10
-4
- 10
-5
m/s and it seems to be insensitive to changes of
soil. But it must ba also noted that inappropiate device
might heva caused the experienced error. Unfortunatley
we couldn’t repeat the test to reveal the reason of this
trend, so these results have not been analyzed in this
study.
• The trend of the permeability coefficient determined with
the Khafagi probe and by calculations based on the
grain size distribution curve is identical to the findings
of laboratory measurements. Each of the three methods
sensed the rise of the coefficient of permeability at the
depth of 3.4 meters.
• Compared to the coefficient of permeability findings of
local measurements and laboratory tests, calculations
from the grain distribution curve produced slight and
more pronounced overestimations for soils of poor and
better permeability, respectively.
The tests performed in the 54+260 km section and at other
locations demonstrated that Khafagi probes lowered by
pumping (or in receiver probes) are best suited to routine tests.
The advantages are laid out below:
• potential to use both above and below ground water,
• can be lowered with any type of probe,
• simple device,
• relatively low measurement costs,
• no complicated measurement and evaluation methods,
• relatively rapid measurement,
• measurement length is adjustable to soil,
• measurement findings include both horizontal and vertical
coefficients of permeability.
Naturally, the studies described above still keep us in the dark
about the exact value of the coefficient of permeability at the
location we examined, but we have measured approximations,
which we know deviate from true values in a certain direction
due to measurement error.
5 CONCLUSIONS
The theories established on the basis of various studies offer a
solution for determining the coefficient of permeability for
instance on the basis of the grain size distribution curve or for
evaluating the findings recorded by the Khafagi probe or the
Menard probe, but we can still entertain doubts about whether
or not the values determined that way are appropriate, the
measurements replicate nature or reveal the k value
characteristic of natural permeation. We have conducted local
and laboratory measurements of the coefficient of permeability,
soil mechanics explorations and identification studied to resolve
these questions.
It is necessary to increase the accuracy of measuring the k
factor, because the relative error of calculations, processing and
geometric dimensioning, etc. is orders of magnitude smaller
than what we can determine for the coefficient of permeability.
Greater accuracy is required because uncertain measurements
lead to unjustified over-dimensioning at times and to running
unnecessarily large risks at other times. It is extremely
important to know the true value of the k factor to avoid that.
There are several methods for the in-situ determination of the
coefficient of permeability. This study and this paper aimed at a
practical comparison of the results of the different methods.
Figure 3 presents the range of validity of each measured value
and method of calculation based on measurement findings and
processing the literature. The same figure shows the
classification of soil types by permeability for the purposes of
various technical interventions.
The studies allow us to establish two important findings:
• There is no universally applicable method and each method
of determining the coefficient of permeability has its
own range of validity. This principle was adopted in the
Hungarian Standard 15295, which was issued in 1999.
• If there the coefficient of permeability of the layers is no
material different, it is not practical to use different
measurement methods in a single borehole and one
must not use different measurement methods at different
depths within one and the same layer, because swapping
methods may result in measured findings showing


