410
Proceedings of the 18
th
International Conference on Soil Mechanics and Geotechnical Engineering, Paris 2013
From Figures 8 and 11 it is also clear that to compact material
in field, a heavy equipment is more effective than to apply many
passes of a light one.
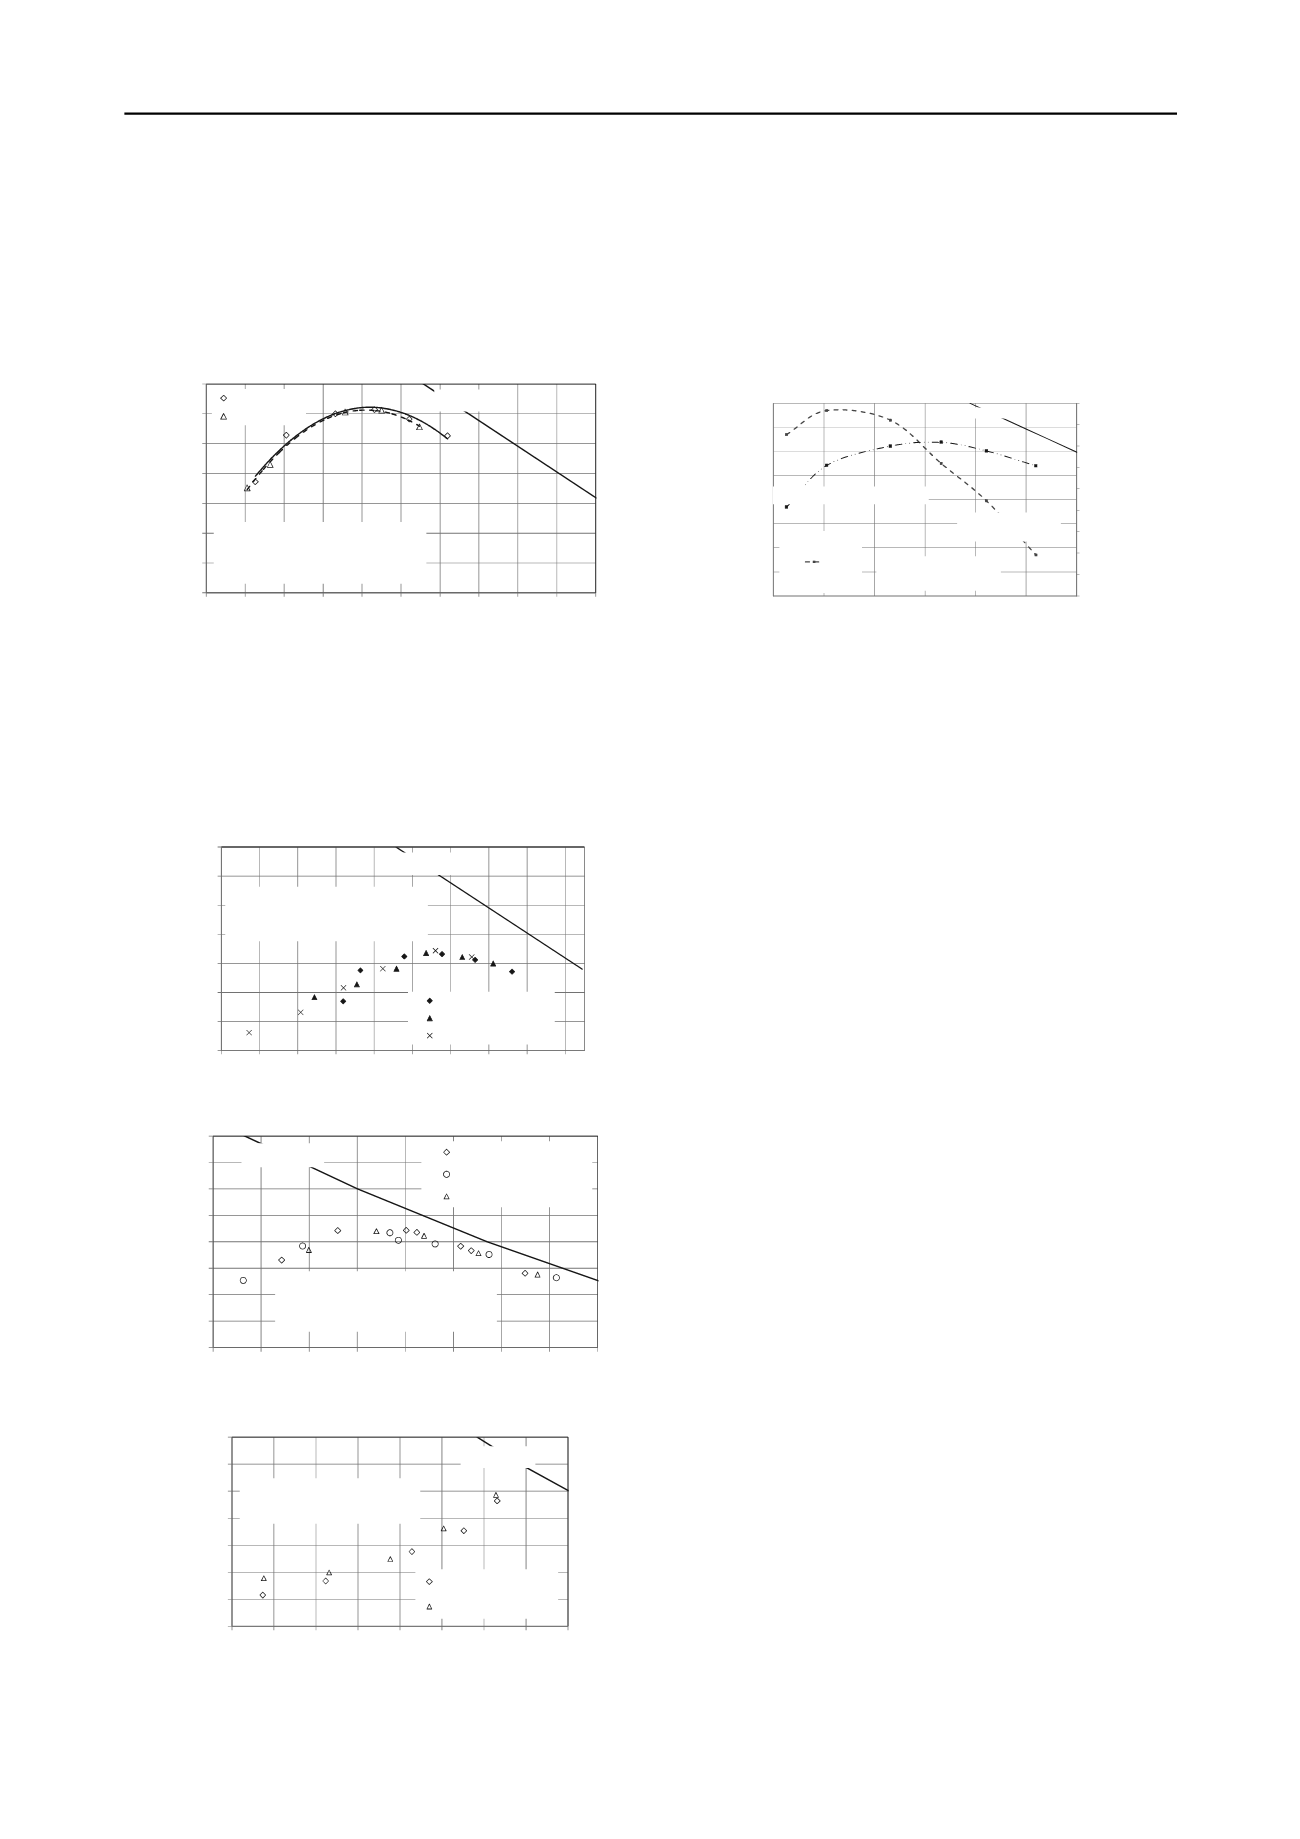
5.2.2 Gyration angle
The data obtained in this study indicates that the compaction
curve is independent of the gyration angles, at least for the two
gyration angles studied (Figure 12).
12.0
12.5
13.0
13.5
14.0
14.5
15.0
15.5
14 16 18 20 22 24 26 28 30 32 34
Dry unit weight (kN/m
3
)
Water content (%)
1.25 degrees
1 degree
Vertical pressure = 600 kPa
Rate: 10 gyrations/minute
Dry unit weights at 500 gyrations
S
r
= 100 %
Figure 12.Effect of gyration angle (CH soil).
5.2.3 Gyration angle
The data obtained in this study indicates that the compaction
curve is independent of the gyration rate, at least for the three
gyration rates studied (Figures 13, 14 and 15). Thus, for
practical purposes it is convenient to carry out the tests at the
highest velocity tested in this study.
12.0
12.5
13.0
13.5
14.0
14.5
15.0
15.5
16 18 20 22 24 26 28 30 32 34
Dry unit weight (kN/m
3
)
Water content (%)
10 gyrations/minute
20 gyrations/minute
30 gyrations/minute
Vertical pressure = 200 kPa
Gyration angle: 1.25 degrees
Dry unit weights at 500 gyrations
S
r
= 100 %
Figure 13.Effect of gyration rate (CH soil).
11.0
11.5
12.0
12.5
13.0
13.5
14.0
14.5
15.0
25 27 29 31 33 35 37 39 41
Dry unit weight (kN/m
3
)
Water content (%)
10 gyrations/minute
20 gyrations/minute
30 gyrations/minute
S
r
= 100 %
Vertical pressure: 200 kPa
Gyration angle: 1.25 degrees
Dry unit weights at 500 gyrations
Figure 14.Effect of gyration rate (ML soil).
12.0
12.5
13.0
13.5
14.0
14.5
15.0
15.5
12 14 16 18 20 22 24 26 28
Dry unit weight (kN/m
3
)
Water content (%)
10 gyrations/minute
30 gyrations/minute
S
r
= 100 %
Vertical pressure: 200 kPa
Gyration angle: 1.25 degrees
Figure 15.Effect of gyration rate (SM soil).
5.3 Shear stresses from gyratory compaction
The data registered during the compaction in the gyratory
compactor not only includes the height of the specimen, the
vertical pressure and the gyration angle, it also contains the
shear stress developed during the whole process of compaction.
Figure 16 shows an example of the magnitude of the shear
stresses that can be developed during the process of compaction
of a claywith 600 kPa of vertical pressure.
12.2
12.6
13.0
13.4
13.8
14.2
14.6
15.0
15.4
15.8
110
130
150
170
190
210
230
250
270
16
18
20
22
24
26
28
Shearstress (kPa)
Watercontent (%)
Vertical pressure= 600 kPa
Rate = 10 gyrations/minute
Gyrationangle =1.25 degrees
500
Dry unit weight (kN/m
3
)
S
r
=100 %
Shear stresscurve
at 500 gyrations
Compactioncurve at 500 gyrations
Figure 16.Shear stress curve for CH soil (600 kPa of vertical pressure).
From Figure 16 it can be observed that the shear stress tends
to increase when the compacted soil is on the dry side of the
compaction curve, however, close to the optimum, the shear
stresses are reduced. It was expected because as the water
content increases the contacts between grains are reduced and as
a consequence the shear stresses are reduced.
6 CONCLUSIONS
The study of the behavior of compacted soils is of paramount
importance becuase this kind of material is involved in the
construction of almost all civil engineering structures. Its
quality control has been determined by the evaluation of two
parameters, that is to say, the field and laboratory density. To
evaluate the second one, the standard or modified Proctor tests
have been in use long time ago, however, these test are far from
developing the same soil structure provided for example for a
sheepsfoot roller which are utilized to compact fine-grained
soils. For this reason, the gyratory compactor has been put
forward as a new lab equipment to determine the standard and
modified compaction curves. This paper presented a series of
compaction curves developed in this equipment. It was
observed that there are a series of combinations of variables that
can be controlled in the gyratory compactor to obtain the
standard compaction curve. On the other hand, the compaction
curves seems to be independent of variables as the gyration
angle and the gyration rate, at least for the two gyration angles
studied and the three velocities. In addition, it is clear that to
increase the dry density of a soil, it is more effective to utilize
heavy equipment that many passes of a light one.
7 REFERENCES
Milberger, L., Dunlap, W. (1966). A gyratory compactor for molding
large diameter triaxial specimens of granular materials.Research
report number 99-2.Texas Highway department in cooperation with
the U.S. Department of Commerce.
Mokwa, R., Cuelho, E., y Browne, M. (2008). Laboratory Testing of
Soil Using Superpave Gyratory Compactor.Transportation
Research Board, 2008.
Ping, W.V., Xing, G., Leonard, M., y Yang, Z. (2003).Evaluation of
Laboratory Compaction Techniques for simulating field soil
compaction (Phase II). Report No. FL/DOT/RMC/BB-890(F).
mpactor_33.
Norma ASTM D 698-07e1, Standard Test Methods for Laboratory
Compaction Characteristics of Soil Using Standard Effort (12 400
ft-lbf/ft
3
(600 kN-m/m
3
)).


