426
Proceedings of the 18
th
International Conference on Soil Mechanics and Geotechnical Engineering, Paris 2013
The drained strength parameters; angle of shearing resistance
φ
'
and effective cohesion c' can be derived from the results of two
or more compression tests (either using multiple testing on the
same sample or sets of two or more compression tests on
samples with similar properties). Alternatively, the strength
parameters can be interpreted from the undrained compression
effective stress path, since the effective stress path for
overconsolidated clays will tend to climb the strength envelope
as the soil dilates and the pore water pressures decrease.
Generally, test interpretation may be difficult in cases where
the specimen experiences destructuration during testing or if the
sample is fissured.
3 DRAINED SHEAR STRENGTH AND PLASTICITY
INDEX
3.1
Drained peak angle of shearing resistance
Figure 5 shows the relationship between the drained peak angle
of shearing resistance
φ
'
oc
and the plasticity index I
P
(single log
plot) as derived from triaxial compression tests performed by
GEO on the various overconsolidated undisturbed clays shown
in Table 1.
φ
'
oc
has generally been derived as a tangent value, to
minimize the otherwise high influence of stress level resulting
from the initially curved failure envelope. Hence, both values of
φ
'
oc
and c'
oc
are obtained from the tests. Results from the older
tests (> 30 years, open points) are shown separately from the
more recent tests (closed points).
The shaded area and dashed lines respectively represents
results of the series of triaxial compression tests on palaeogene
clays and glacial till deposits (Lower and Upper till) performed
in connection to the Fehmarnbelt (Fixed Link) 2011 ground
investigation. The spans shown in the I
P
and
φ
'
oc
values
represent mean values ± 1 standard deviation.
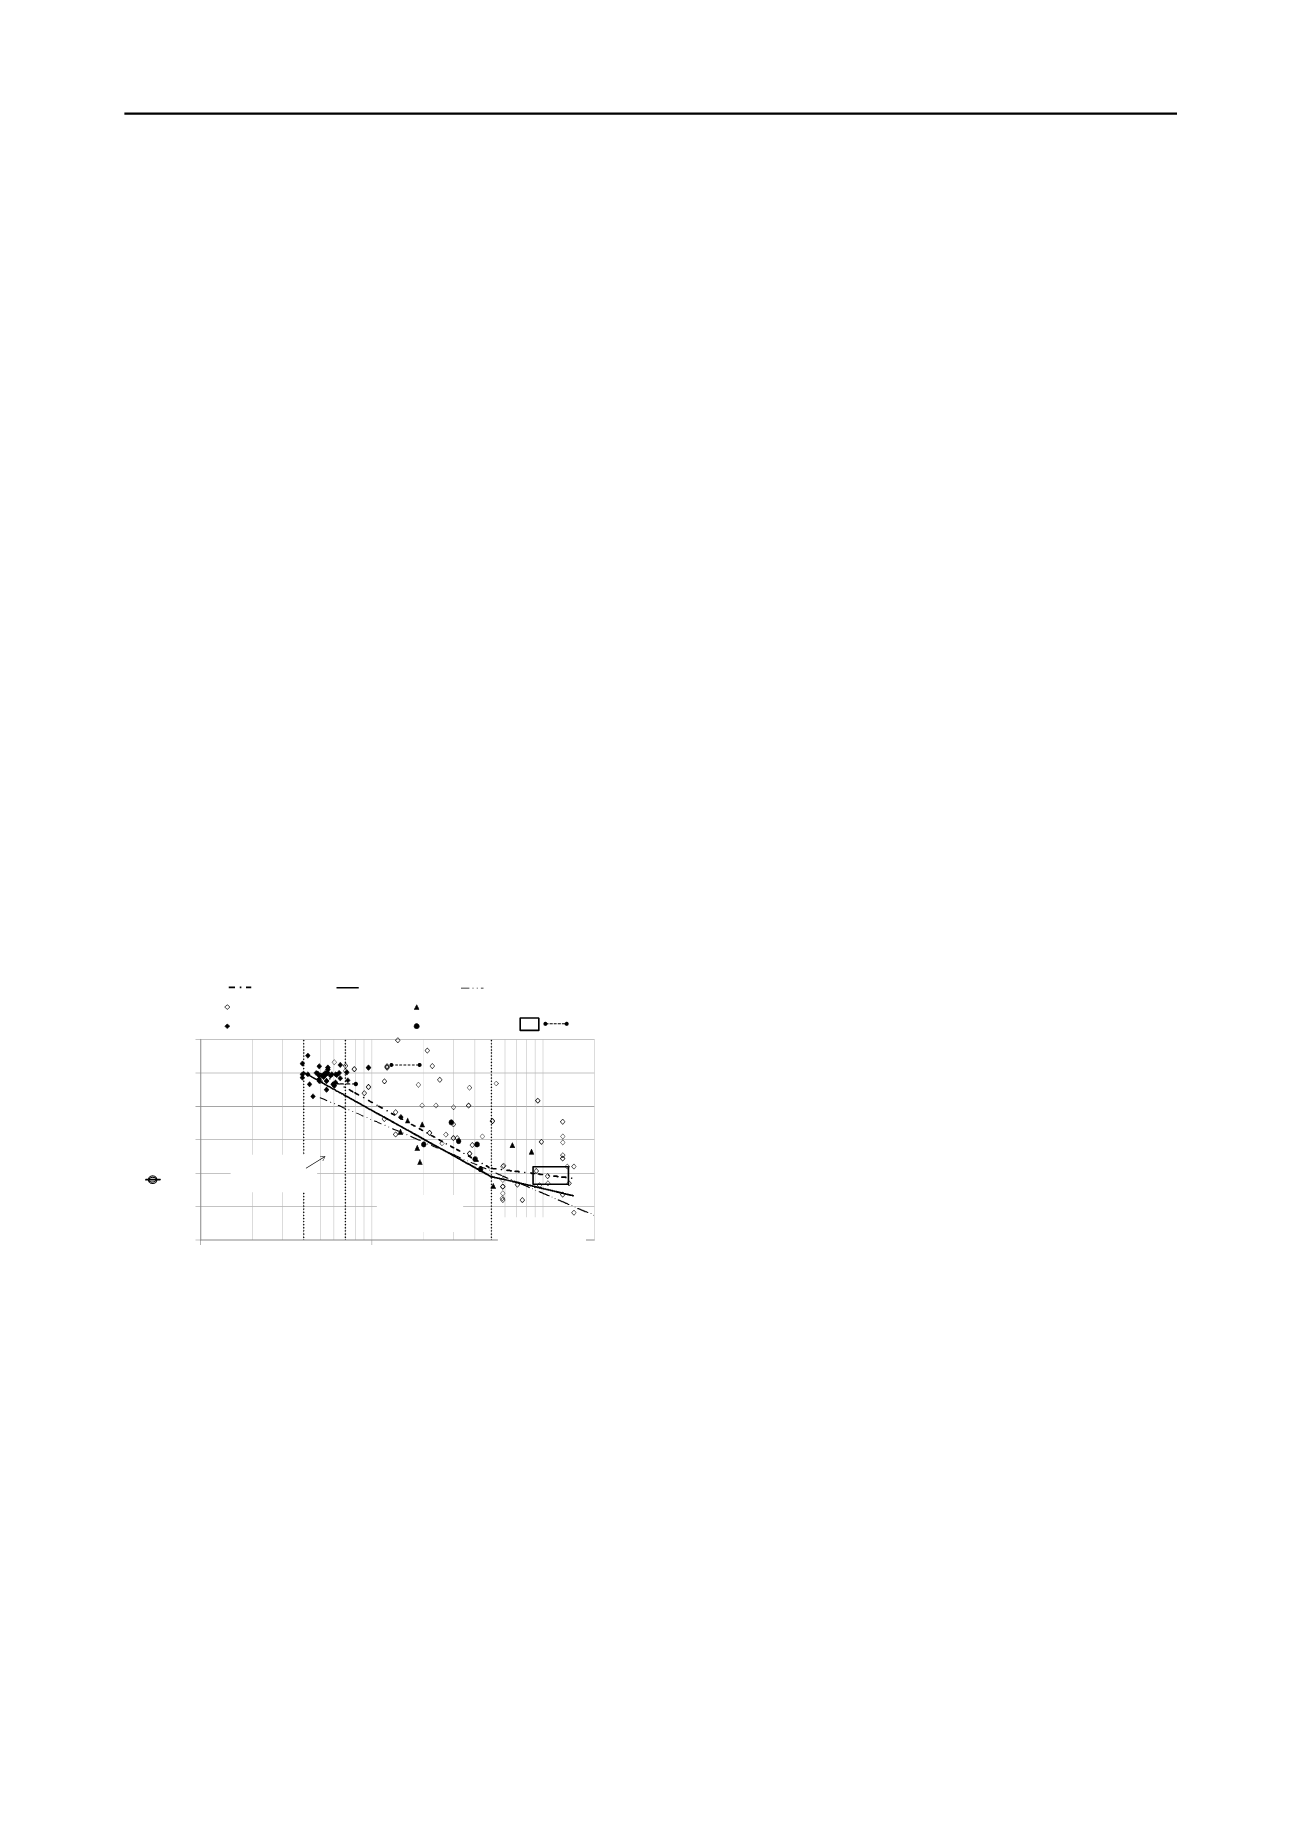
Figure 5. Relationship between peak angle of shearing resistance
φ
'
oc
and plasticity index I
P
for overconsolidated undisturbed clays
A large scatter in the data and a trend of reducing
φ
'
oc
with
increasing I
P
is generally seen similarly to what was observed
for NC clays in figure 2.
It is observed that the old triaxial test results generally show
a much larger spread than the results of the presumably more
reliable recent triaxial tests. Furthermore, the new test data tend
to be found in the lower half of the range of results from the old
tests. This indicates that
φ
'
oc
is likely to be overestimated by the
old tests. The use of high strain rates and the lack of full
saturation in the old undrained CU
u=0
triaxial compression tests
are likely to have lead to some uncertainties in the actual
effective stress state at failure. This may explain some of the
observed differences between the results from the old and more
recent triaxial compression tests.
As for NC clays some of the scatter may arise as a result of
variations in clay-size fraction, since this is not accounted for
solely by the variations in I
P
. Variations in stress level on the
other hand should have less of an influence, since a tangent
value of
φ
'
oc
is derived from a failure envelope which is
approximately linear within the typical stress range (100-
600kPa), as seen in Figures 8-10. As mentioned previously,
difficulties in test interpretation and influence of fissures and
destructuration may have influenced some of the results.
Based on previous experience and much of the old data
shown in Figure 5 within the I
P
range of 6%-106%, GEO
(Knudsen 1981) has since the early 80’s suggested using the
following correlation to get a cautious lower bound estimate of
φ
'
oc
on the basis of a mean value of I
P
:
φ
'
oc
= 45-15
·
log I
P
(deg.)
(4)
In the light of the more recent test data, which extends the I
P
range, especially in the high I
P
end, to 4%-151%, it is suggested
that the lower bound values of
φ
'
oc
should be slightly less than
previously predicted by eq. 3 for very low I
P
clays and
somewhat higher for high plasticity clays (I
P
>50%). Hence, it is
suggested to use the following revised cautious lower bound
(LB) estimate of the relationship between
φ
'
oc
and the plasticity
index I
P
as given by eq. 5 and 6, and shown in Figure 5 (solid
line):
Cautious LB estimate:
4<I
P
<50
φ
'
oc
= 44-14
·
log I
P
(deg.)
(5)
50
≤
I
P
<150
φ
'
oc
= 30-6
·
log I
P
(deg.)
(6)
For an I
P
value of 100%, which is typical for e.g. Røsnes clay,
this means that the lower bound estimate increases from a peak
value of 15 deg. using eq. 4 to 18 deg. using eq. 6.
The best estimate given by the best-fit regression line
through the recent test data is shown in Figure 5 (chain dotted
line) and is given by:
Best estimate:
4<I
P
<50
φ
'
oc
= 45-14
·
log I
P
(deg.)
(7)
50
≤
I
P
<150
φ
'
oc
= 26-3
·
log I
P
(deg.)
(8)
Eq. 5.-8. are believed to be applicable to most overconsolidated
natural clays with clay-size fractions below 80%. For soils with
clay-size fractions higher than 80% the above relationships
should be used with caution until its validity is confirmed by
additional tests.
It should be noted that some cases may dictate a mobilized
angle of shearing resistance which is lower than the above
estimated peak values, e.g. when progressive failure is
considered in connection to slope stability analysis in high
plasticity clays (Skempton 1977, Burland 1990).
The lower bound estimate for NC clays is shown in Figure 5
(dash-double-dot line) for comparison. It is observed that the
lower bound estimates for NC and OC clays do not deviate
much.
3.2
Effective cohesion
Figure 6 shows the relationship between the cohesive intercept
of the strength envelope c'
oc
and the plasticity index I
P
(single
log plot). Data from recent tests and older tests (>30 years) are
separated. Two sets of c'
oc
values have been plotted: the derived
values from the tests and estimated values of c'
oc
. The derived
values have been interpreted from the tests results and are
paired with the
φ
'
oc
values shown in Figure 5. While the
estimated value of c'
oc
is found from each failure point (
σ
'
f
,
τ
f
)
by subtracting the stress dependent “frictional” strength
contribution
σ
'
f
·
tan(
φ
'
oc
) from the shear strength
τ
f
. This can also
be expressed in terms of mean effective stress s'
f
=½(
σ
'
1
+
σ
'
3
)
and shear stress t
f
=½(
σ
'
1
-
σ
'
3
) from the following equation.
10
15
20
25
30
35
40
1
10
100
φ
'
oc
(deg.)
I
p
(%)
Older triaxial test (>30 yrs, n=61)
Other recent triaxial test (n=8)
GB (1992, n=38)
EB (2011, n=6)
V. low
plasticityclays
FB (2011)
Very high
plasticityclays
Lowto high
plasticityclays
(n=8)
(n=58)
Best fit OC clays Cautious LB OC soils Cautious LB NC soils
(n=5)


