435
Technical Committee 101 - Session II /
Comité technique 101 - Session II
with minor scatters. Obviously,
G
decreases with increasing the
normalized
w
/
w
L
, meaning that
w
L
defines the magnitude of
G
regardless types of soils. In this case,
G
24
value at
w
L
appears
around 200 kPa.
By extruding data of Hachirogata clay, because of a strange
point in the
G
24
and
w
/
w
L
relation as shown in Fig. 3, the
correlations of hardening
G
and normalized
w
/
w
L
at not only 24
hours but also various times are plotted in Fig. 4 to examine the
effect of thixotropy corresponding to wide range of water
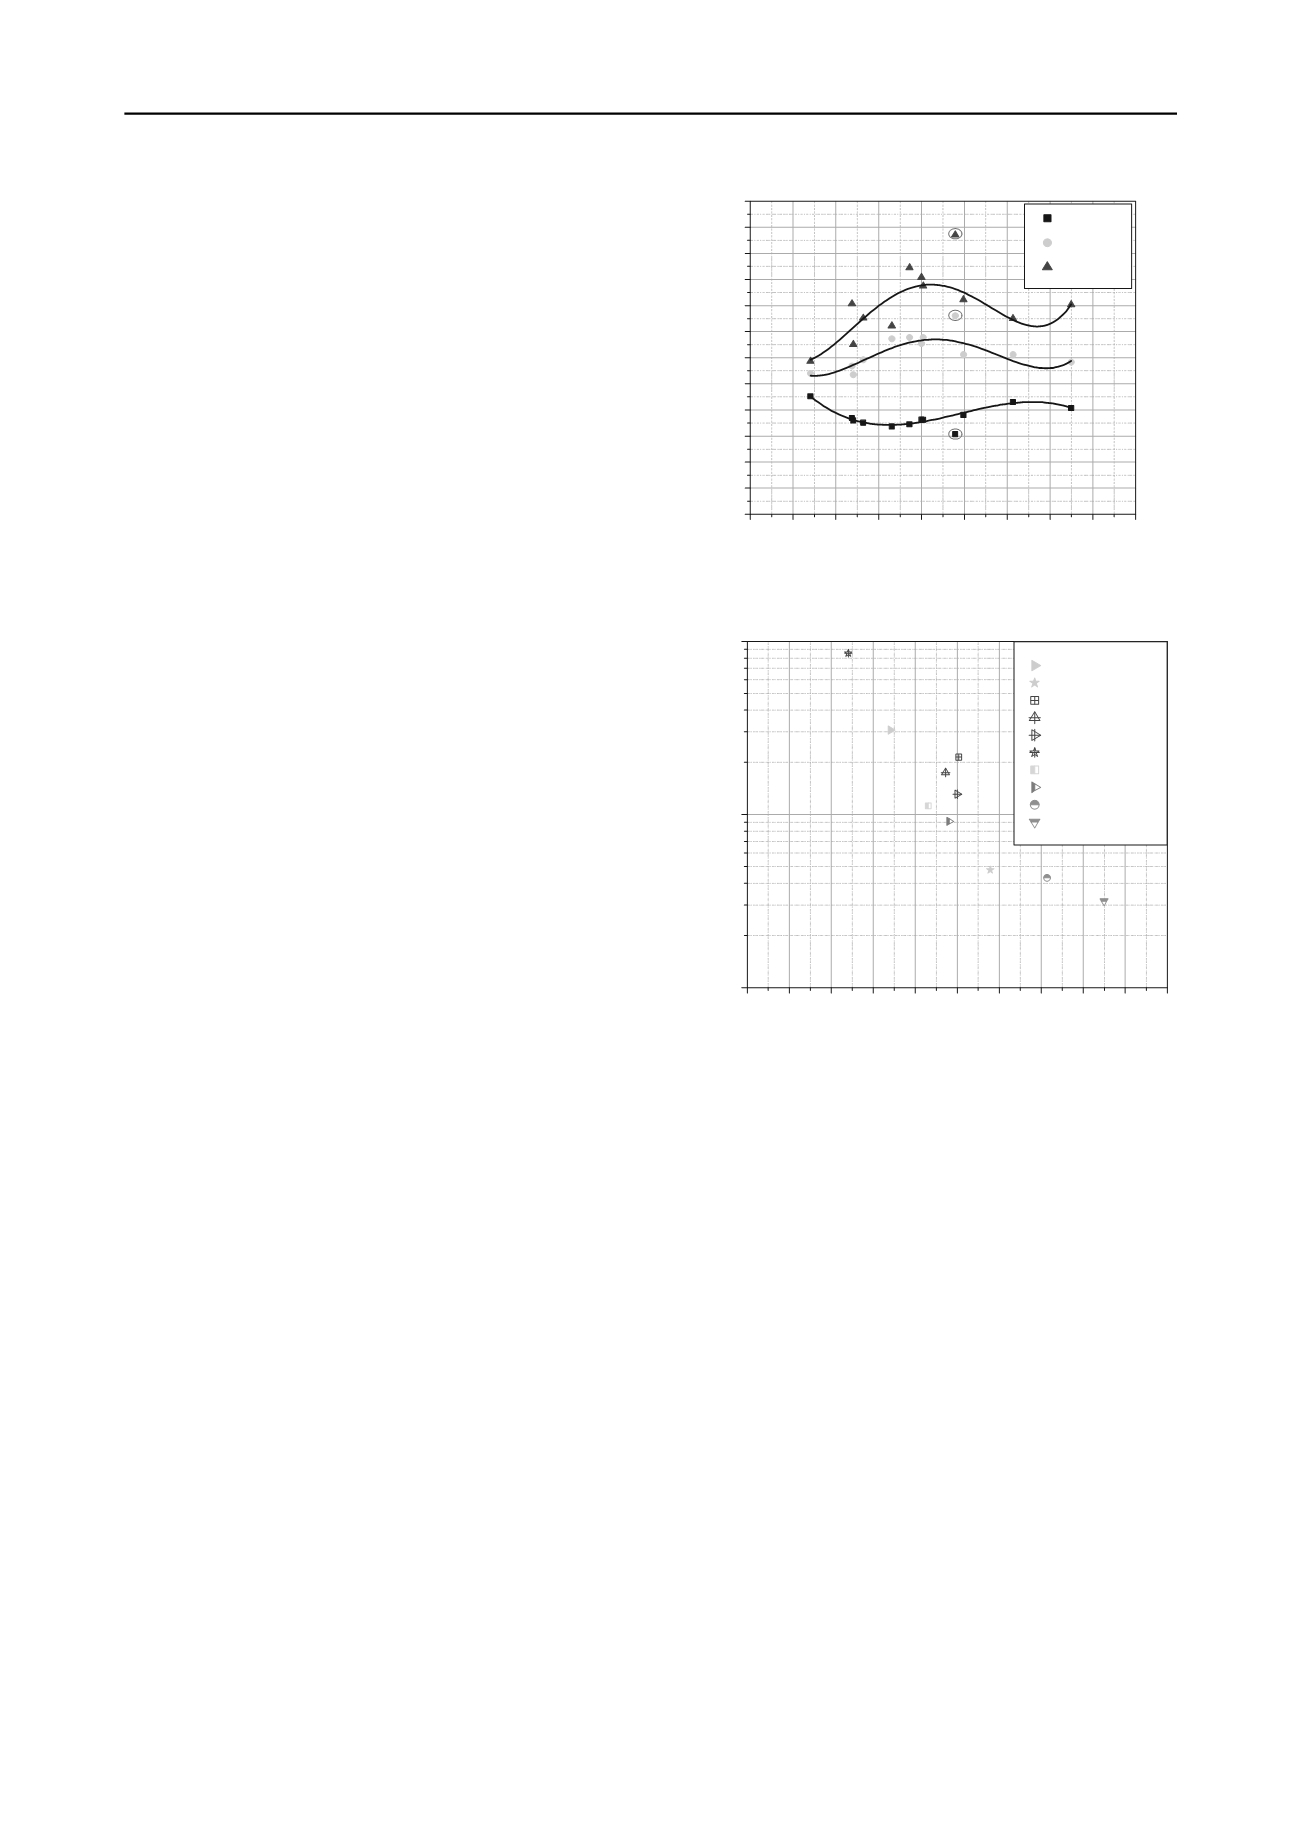
content. It can be seen in the figure that the increment of
G
to
time at around
w
L
is the largest, while at smaller water contents
than
w
L
, say, when
w
/
w
L
is less than 0.8, the tendency of
G
increasing against time becomes smaller.
3.2
Undrained Shear Strength by Vane Test
Although the figure is not presented in this paper, it is also
observed in laboratory vane test that the shear strength increases
with time. The values of
s
u
measured at 24 hrs (
s
u24
) are plotted
with normalized
w
/
w
L
in Fig. 5, in the same manner as
G
24
shown in Fig. 3. Almost a linear correlation between
s
u24
in the
logarithm scale and
w
/
w
L
ratio is also identified, but more
remarkable scatters and slightly steeper gradient are recognized
than those in Fig. 3. At
w
L
, the magnitude of
s
u24
varies from
about 1 to 2 kPa, whose values are somewhat lower than those
suggested by Wood (1990), who did not consider the
thixotropic hardening effect and recommended 2 kPa of
s
u
at
w
L
.
Relationship between thixotropic hardening
G
and
s
u
at
various elapsed times is shown in Fig. 6 together with that
obtained from cement-treated soil (CTS) material proposed by
Seng and Tanaka (2011). They found that
G
and
s
u
relation of
CTS can also be applicable to most of worldwide natural clays
with
s
u
varied from 10 to 150 kPa. It is observed in Fig. 6 that at
very high water content corresponding to low initial strength,
s
u
remains constant until a certain time unlike
G
. After
G
reaches a
certain values,
s
u
starts to increase and the relation of
G
and
s
u
seems to approach to the same line as CTS. Indeed, Seng and
Tanaka (2011) reported that even CTS material behaves the
similar way when the strength of CTS is extremely small.
However, when strength of CTS is greater than 1 kPa, the
G
and
s
u
correlation for each sample forms linear function, unlikely
very soft clays that show a monotonic increase. Both behaviors,
the constant values and slow increases of
s
u
, are quite
interesting and might be associated with viscosity or strain rate
effect which is obviously an important factor governing soil
strengths especially when material remains soft; however
further investigation is necessitated to confirm this presumption.
4 SHEAR MODULUS MEASUREMENT DRUING
SECONDARY CONSOLIDATION
The development of
G
during secondary consolidation is also an
interesting topic. It should be noted that the condition of the
secondary consolidation is under a constant effective stress but
the volume is changing, while in the thixotropic condition, the
volume change does not take place. Therefore, it may be
anticipated that the increase rate of hardening
G
owing to the
secondary consolidation should be greater than that of
thixotropy, as decreasing void ratio during the secondary
consolidation. As shown in Figs. 7 and 8, however, the increase
in
G
during the secondary consolidation is considerably smaller
than that in Thixptropy test. Figure 7 shows test results from the
thixotropy test, where
G
is normalized by
G
at 1 hour after
remolding (
G
at1h
). In Fig. 8, change in
G
during the secondary
consolidation is shown. The end of primary consolidation
(EOP) was estimated by the root
t
method, and it is assumed
that the effective stress is constant after EOP. Both axes in the
figure are normalized by time at EOP (
t
EOP
) and
G
at EOP
Figure 4. Increase in
G
due to time at different
w
.
Figure 5. Relationship between
w
/
w
L
and
s
u
measured by vane after 24
hours.
(
G
EOP
). The reason for small increment
G
during the secondary
consolidation might be explained by destruction of the
interparticle bounding, which is created during the thixotropy
process.
5 CONCLUSIONS
The experimental results of thixotropic phenomenon measured
on various clays are presented and compared with values
obtained by consolidation test with low pressures. Main
conclusions can be drawn as following:
1) Bender element test is a powerful tool and an appropriate
method for evaluating the thixotropic hardening stiffness of
very soft clays, since it are able to detect even small changes
in
G
with an extremely small strain.
2)
G
at 24 hours for
w
L
is around 200 kPa.
3) Regardless of soil types, thixotropy affects the clay most
strongly at around liquid limit state and becomes less
remarkable at lower and higher water contents.
4) The correlation between
G
and
s
u
for very soft clays is
analogous to that of cement-treated soil proposed by Seng and
Tanaka (2011). Additionally, similar behavior is recognized at
very low strengths, where
s
u
appears constant while
G
increases.
0.6 0.7 0.8 0.9 1.0 1.1 1.2 1.3 1.4 1.5
0.0
0.2
0.4
0.6
0.8
1.0
1.2
1.4
1.6
1.8
2.0
2.2
2.4
G
10
/
G
24
G
48
/
G
24
G
120
/
G
24
Normalized
G/G
24
Normalized
w
/
w
L
0.5 0.6 0.7 0.8 0.9 1.0 1.1 1.2 1.3 1.4 1.5
0.1
1
10
F1 (40.9%; 0.84)
F2 (52.5%; 1.08)
K1 (62.3%; 1.00)
K2 (60.6%; 0.97)
K4 (62.1%; 1.00)
K5 (46.0%; 0.74)
N1 (54.0%; 0.93)
H1 (241.3%; 0.98)
T1 (134.3%; 1.21)
T2 (149.3%; 1.35)
Undrained Shear Strength at 24hrs,
s
u24
(kPa)
Normalized
w
/
w
L


