427
Technical Committee 101 - Session II /
Comité technique 101 - Session II
,
=
−
∙ ′
,
′
,
(9)
where
φ
'
oc,est
is the the lower bound estimate of the angle of
shearing resistance, as given by eq. 5. and 6. on the basis of I
P
.
The estimated c'
oc
may show negative values in cases where the
estimation of
φ
'
oc
is too high.
The intercept of the strength envelope is very sensitive to the
interpretation of the test results, and factors like destructuration
or influence of fissures may have great impact on the failure
points and hence the value of c'
oc
. The scatter in the data points
will therefore be very significant, much more so than what was
observed for
φ
'
oc
in figures 2 and 5. Despite the scatter a weak
trend of reducing lower bound value of c'
oc
with increasing I
P
is
seen for I
P
greater than 7%. Part of the data from the old tests
has been excluded since it is not certain if the meltwater and late
glacial marine deposits are heavily overconsolidated
(overconsolidation ratio OCR>4).
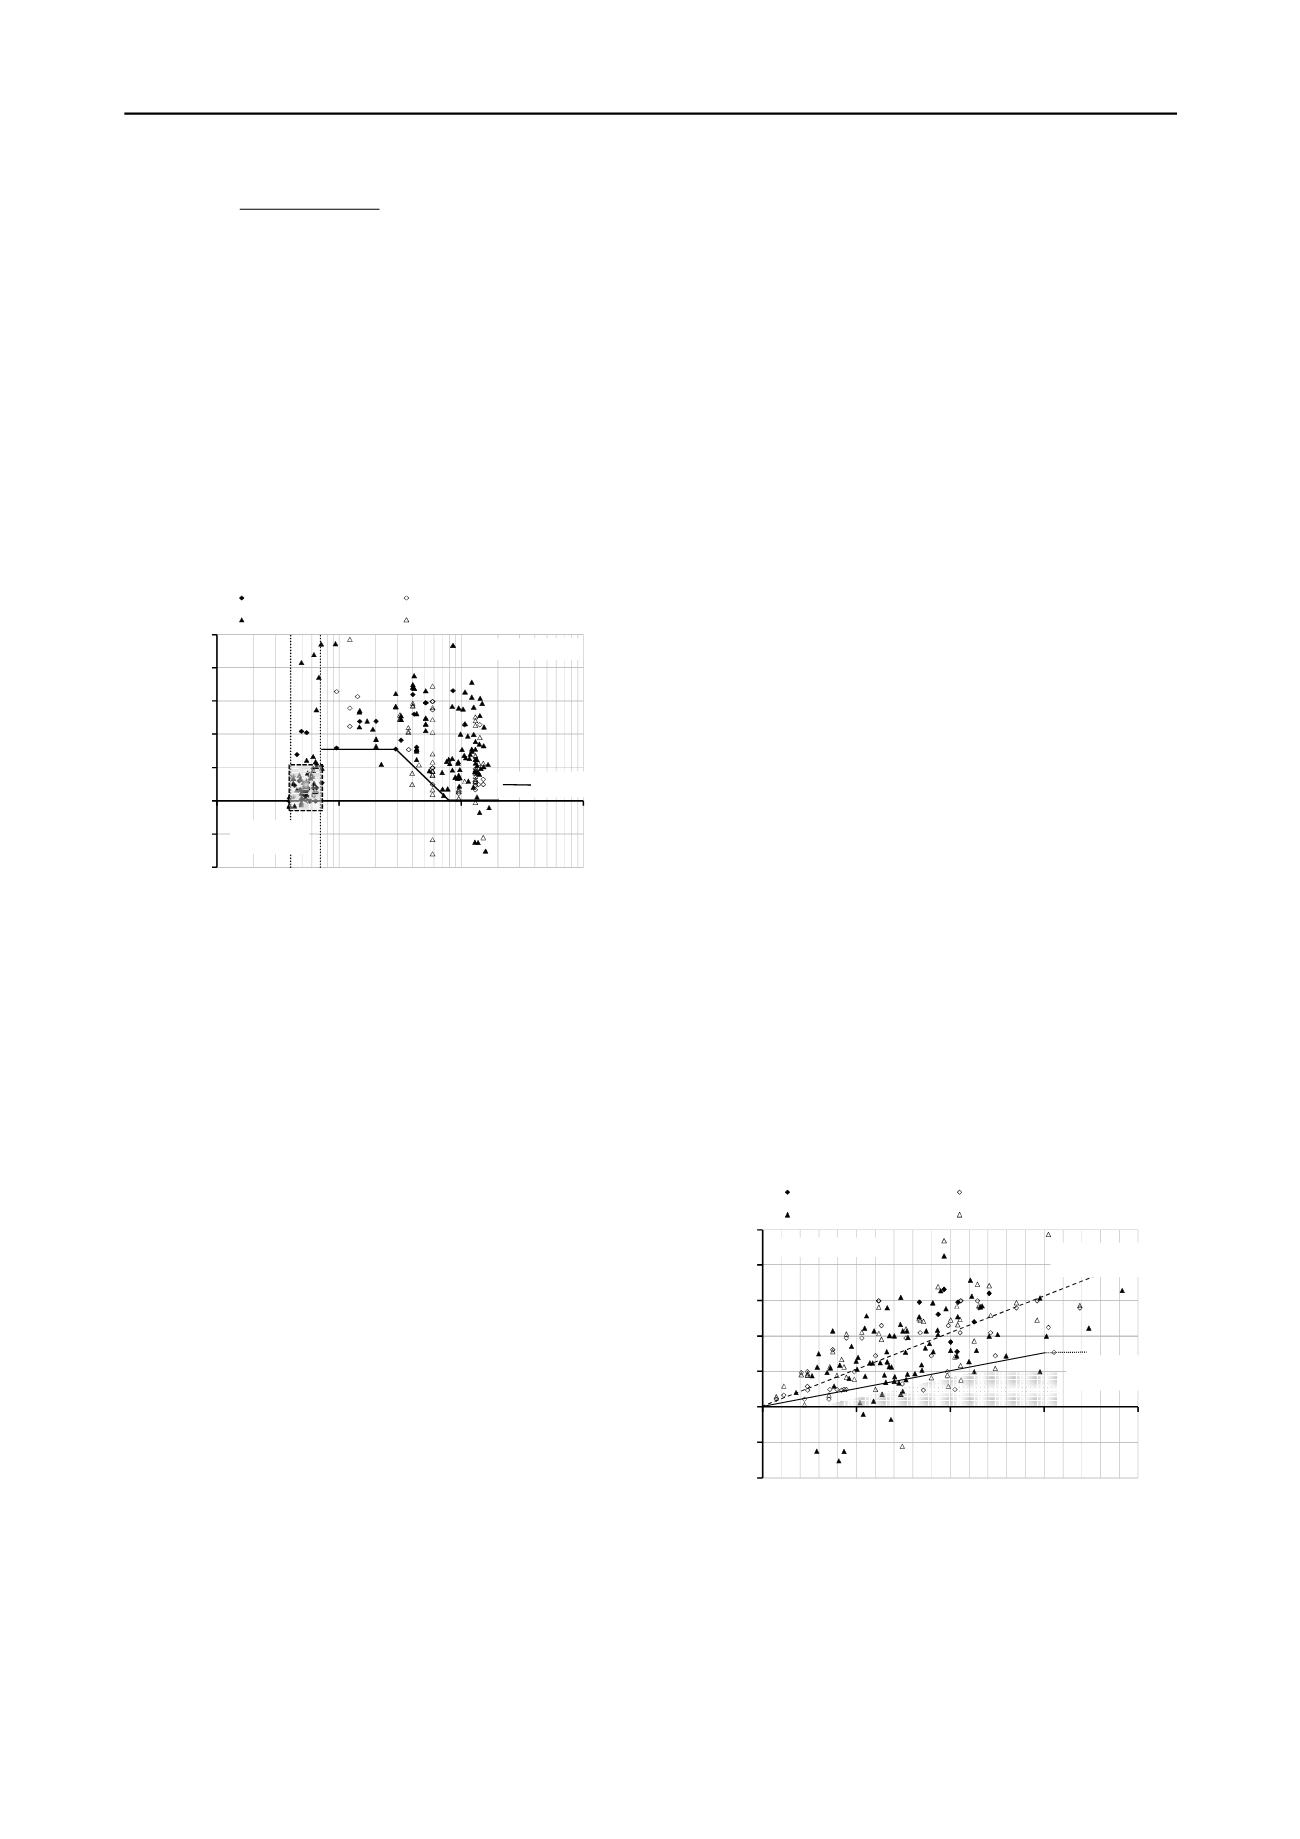
Figure 6. Relationship between effective cohesion c'
oc
and plasticity
index I
P
for overconsolidated undisturbed clays
The test results from the Great Belt bridge ground
investigation (GB) on very low I
P
(4%<I
P
<7%) clay till are seen
to deviate significantly from the general trend by showing
relatively low c'
oc
values; typically between 0 and 15kPa. This
is true for both the derived and estimated values of c'
oc
. One or
several factors might explain this, among others: a) Some of the
tested clays are possibly ablation tills that are deposited in a
nearly normally consolidated state. b) The clay till may have
been subject to postdepositional geological processes (e.g.
subsequent passing of ice sheets, meltwater, heave etc.), which
may have disturbed the structure and erased the effects of
overconsolidation. c) Generally, the tested clay tills have a high
content of silt, sand and gravel, and the soils can therefore be
characterized as transitional soils, which in terms of strength
may behave more like a frictional soil (c'
≈
0kPa) than clay. This
is further supported by the fact that the I
P
value is likely to be
overestimated, as particles larger than 0.425mm have been
removed prior to classification in accordance with BS1377:part
2:1990. An estimated 20-40% of the soil particles have been
removed. Hence sand till or gravel till may in most cases be a
more representative classification for the tested till deposits.
The low c'
oc
values observed at very high I
P
values above
60% are likely to be a result of fissures and/or sample
destructuration. Destructuration may result from large straining
events during sampling, sample preparation, testing or
geological history. The Palaeogene clays from the Fehmarnbelt
(Fixed Link) project mostly belong to an upper stratum which is
folded by glacier. Hence, the measured strengths are likely to be
influenced by varying degrees of destructuration caused by
glacial disturbance of the otherwise intact clay layers.
The significant variation in the c'
oc
values seen in Figures 6
and 7 also seem to indicate this. For heavily overconsolidated
clays with 7%<I
P
<80% the test data indicate a cautious lower
bound estimate of the relationship between
c'
oc
and the
plasticity index, I
P
as shown on Figure 6 (solid line) and given
by the following equations depending on the value of I
p
:
Cautious lower bound estimate:
7%<I
P
<30%
c'
oc
= 30
(kPa)
(10)
30%
≤
I
P
<80%
c'
oc
= 48-0.6
·
I
P
(kPa)
(11)
I
P
>80%
c'
oc
= 0
(kPa)
(12)
While the drained angle of shearing resistance
φ
'
oc
is more
naturally linked to soil mineralogy composition, as expressed
partly by the I
P
value, the apparent effective cohesion is more
naturally linked to the soil structure and dilative tendencies. As
the I
P
value is determined from reconstituted state it does not
take account of soil structure. Hence, the above relationship
between c'
oc
and I
P
may not be the most appropriate to use.
As suggested in the previous Danish code of practice for
foundations (Danish Standard DS 415) it may be expected that
the value of c'
oc
is better related to the undrained shear strength
c
u
rather than I
P
. Both c
u
and c'
oc
are influenced by soil structure
and dilation, but as the stress level is likely to have a greater
impact on c
u
than c'
oc
, the relationship will not be unique. Based
on a comparison of the drained and undrained bearing capacity
in connection to plate loading tests on clay till (Jacobsen 1970),
the previous Danish code of practice for foundations suggests
the following cautious estimate of c'
oc
on the basis of c
u
:
c'
oc
= 0.1
·
c
u
(kPa)
(13)
Figure 7 shows the relationship between c'
oc
and c
u
based on
data from the performed tests. As before both derived values
from the tests and estimated values of c'
oc
are shown. As
expected the observed scatter is very significant, but there is a
tendency of increasing values of c'
oc
with increasing values of
c
u
. Both recent and older data appear to verify that the
relationship between c'
oc
and c
u
given by eq. 13 can be used as a
cautious lower bound estimate with an upper limit of c'
oc
=30kPa for all heavily overconsolidated clays except very low
I
P
clay till. For very low I
P
clay till the effective cohesion c'
oc
is
in the majority of cases found to be lower than given by eq. 13,
as shown by the shaded area in Figure 7. Hence, in agreement
with observations from Figure 6 it is suggested to use c'
oc
=0kPa
for very low I
P
(4%<I
P
<7%) clay till/transitional soils
independently of c
u
, unless specific triaxial test data is available
to suggests otherwise. c'
oc
=0kPa should also be assumed for
fissured high plasticity clays in cases where the overall
mobilized strength may be governed by the fissure strength.
Figure 7. Relationship between effective cohesion c'
oc
and undrained
shear strength c
u
for overconsolidated undisturbed clays
Generally it is suggested to estimate c'
oc
on the basis of eq. 13
for clays with I
P
values between 7% and 150%. It should
however be noted that if both
φ
'
oc
and c'
oc
are estimated
cautiously using the above correlations then the estimated
combined strength may in some cases be too conservative. On
the other hand, the combined strength found from the proposed
correlations may overestimate the strength at low effective
-40
-20
0
20
40
60
80
100
1
10
100
1000
c'
oc
(kPa)
I
p
(%)
c' derived - recent data
c' derived - olddata
c' estimated -recent data
c' estimated - old data
4%<I
p
<7% clay
till(GB)
LB estimate
OCclays7%<I
P
<170%
-40
-20
0
20
40
60
80
100
0
100
200
300
400
c'
oc
(kPa)
c
u
(kPa)
c' derived - recent data
c' derived - old data
c' estimated - recent data
c' estimated - old data
c'=0.1·c
u
,
c' max. 30 kPa
4%<I
p
<7% clay till (GB)
OCclays 7%<I
P
<170%
Meanc'=0.2·c
u
(estimated recent data)


