437
Comparative study of long-term consolidation for subsoils under Kansai Airport and
Pisa Tower
Etude comparative de la consolidation à long terme pour les sous-sols d’aéroport de Kansai et de
tour de Pise
Watabe Y., Sassa S.
Port and Airport Research Institute, Yokosuka, Japan
Udaka K.
Oyo Corporation, Saitama, Japan
ABSTRACT: In both the Kansai International Airport and Leaning Tower of Pisa, long-term consolidation settlement is a very
important geotechnical issue. In this study, a series of long-term consolidation tests were conducted for undisturbed samples retrieved
from these two sites. The isotache concept observed in the long-term consolidation behavior was successfully modeled by a simple
equation, and then the difference in long-term consolidation behavior between the Osaka Bay clay (significant delayed consolidation)
and Pisa clay were compared and discussed. Using the isotache model, the long-term consolidation settlement can be quantitatively
predicted in association with the strain rate dependency.
RÉSUMÉ: Pour l’aéroport international de Kansai et la tour penchée de Pise, le tassement de consolidation à long terme constitue une
problématique géotechnique très importante. Dans cet article, on présente une série d’essais de consolidation à long terme réalisés
pour des échantillons intacts prélevés sur ces deux sites. Le concept isotâche, observé dans la consolidation à long terme, a pu être
modélisé par une équation simple. Les différences de consolidation à long terme observées entre l’argile de la baie d’Osaka
(consolidation retardée significative) et l’argile de Pise ont été comparées et discutées. En utilisant le modèle isotâche, le tassement de
consolidation à long terme peut être quantitativement évalué en association avec la dépendance en vitesse de déformation.
KEYWORDS: long-term consolidation, isotache, strain rate.
1 INTRODUCTION
In both the Kansai International Airport and Leaning Tower of
Pisa, long-term consolidation settlement is a very important
geotechnical issue. Observed settlements at the two sites are,
however, difficult to be directly compared, because their scale
and mechanism are different.
In this study, a series of long-term consolidation tests were
conducted for undisturbed samples retrieved from these two
sites. The test results were interpreted based on the most recent
findings from the isotache concept, which considers strain rate
dependency in preconsolidation pressure. Then, essential
difference between the long-term consolidation behaviors at
these two sites was clarified in association with the strain rate
dependency.
w
L
w
p
w
n
0
50
100
150
200
0 60 120
Water content w (%)
Depth z (m)
silt
clay
sand
0
50
100
150
200
0
50 100
Fraction (%)
0
50
100
150
200
2.5
3.0
s
(g/cm
3
)
y
'
v0
0
50
100
150
200
0 1500 3000
Yieldstress
y
(kPa)
0
50
100
150
200
1 2 3
OCR
0
50
100
150
200
1.0 1.5 2.0
H. clay
Ma13
sand
P. clay
Ma12
P. clay
Ma11
P. clay
Ma10
p
c
P. clay
Ma9
P. clay
sand
P. clay
Ma7
Void ratio e
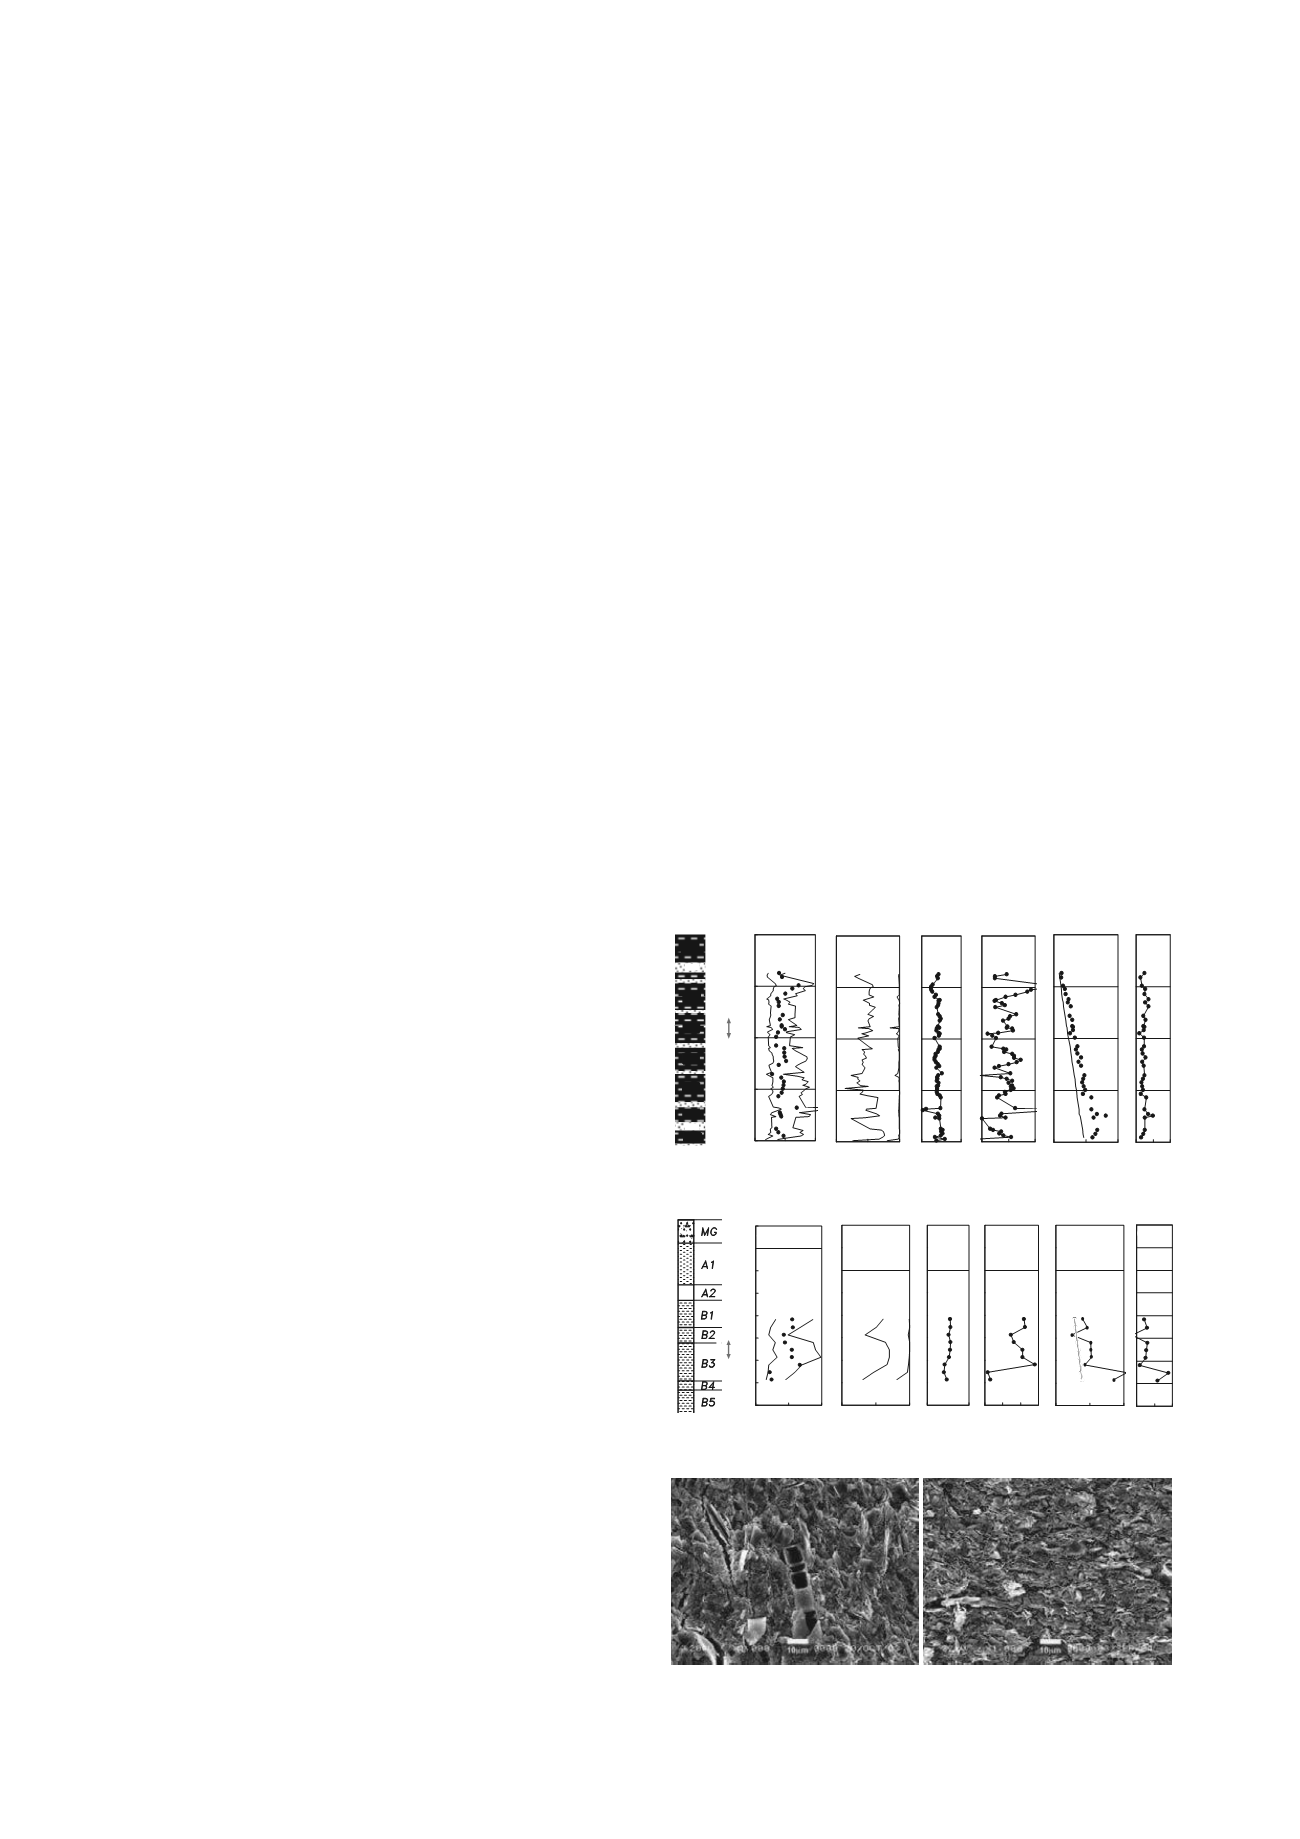
2 PHYSICAL AND MECHANICAL PROPERTIES OF
THE CLAYS
Osaka Bay clay (Kansai International Airport) and Pisa clay
have common characteristics, such as soil consistency (
w
L
≈
80%,
I
p
≈ 50), grain-size distribution (clay fraction (< 2 μm) of
50%, fine particle fraction (< 75 μm) of 100%), void ratio (
e
≈
1.5), overconsolidation ratio (OCR ≈ 1.4), etc, as shown in
Figure 1. Dominant clay minerals from X-ray diffraction are
different: smectite and kaolinite for Osaka Bay clay and illite
for Pisa clay. Micro-fabrics observed by scanning electron
microscope (SEM) are shown in Figure 2. Osaka Bay clay is
consisted of flaky particles (typically smectite) forming
aggregations with abundant microfossils (typically diatoms).
Pisa clay is consisted of platy particles (typically illite) with a
small number of microfossils.
p
c
Figure 1a. Depth profiles of soil properties for the Osaka Bay clay.
0
3
6
9
12
15
18
21
24
0.0
50.0 100.0
Water content
w
(%)
Depth
z
(m)
w
p
w
L
w
n
(a)
0.00
3.00
6.00
9.00
12.00
15.00
18.00
21.00
24.00
0
50
100
Fraction (%)
Clay
Silt
Sand
(b)
0.00
3.00
6.00
9.00
12.00
15.00
18.00
21.00
24.00
2.5
3.0
s
(g/cm
3
)
(c)
0.00
3.00
6.00
9.00
12.00
15.00
18.00
21.00
24.00
0
250
500
Yield stress
p
'
y
(kPa)
'
v0
p
'
y
(e)
0.00
3.00
6.00
9.00
12.00
15.00
18.00
21.00
24.00
0.5 1.0 1.5 2.0
Void ratio
e
(d)
0.00
3.00
6.00
9.00
12.00
15.00
18.00
21.00
24.00
1 2 3
OCR
(f)
p
c
c
Figure 1b. Depth profiles of soil properties for the Pisa clay.
(a) The Osaka Bay clay. (b) The Pisa clay.
Figure 2. Microfabrics observed by SEM.


