438
Proceedings of the 18
th
International Conference on Soil Mechanics and Geotechnical Engineering, Paris 2013
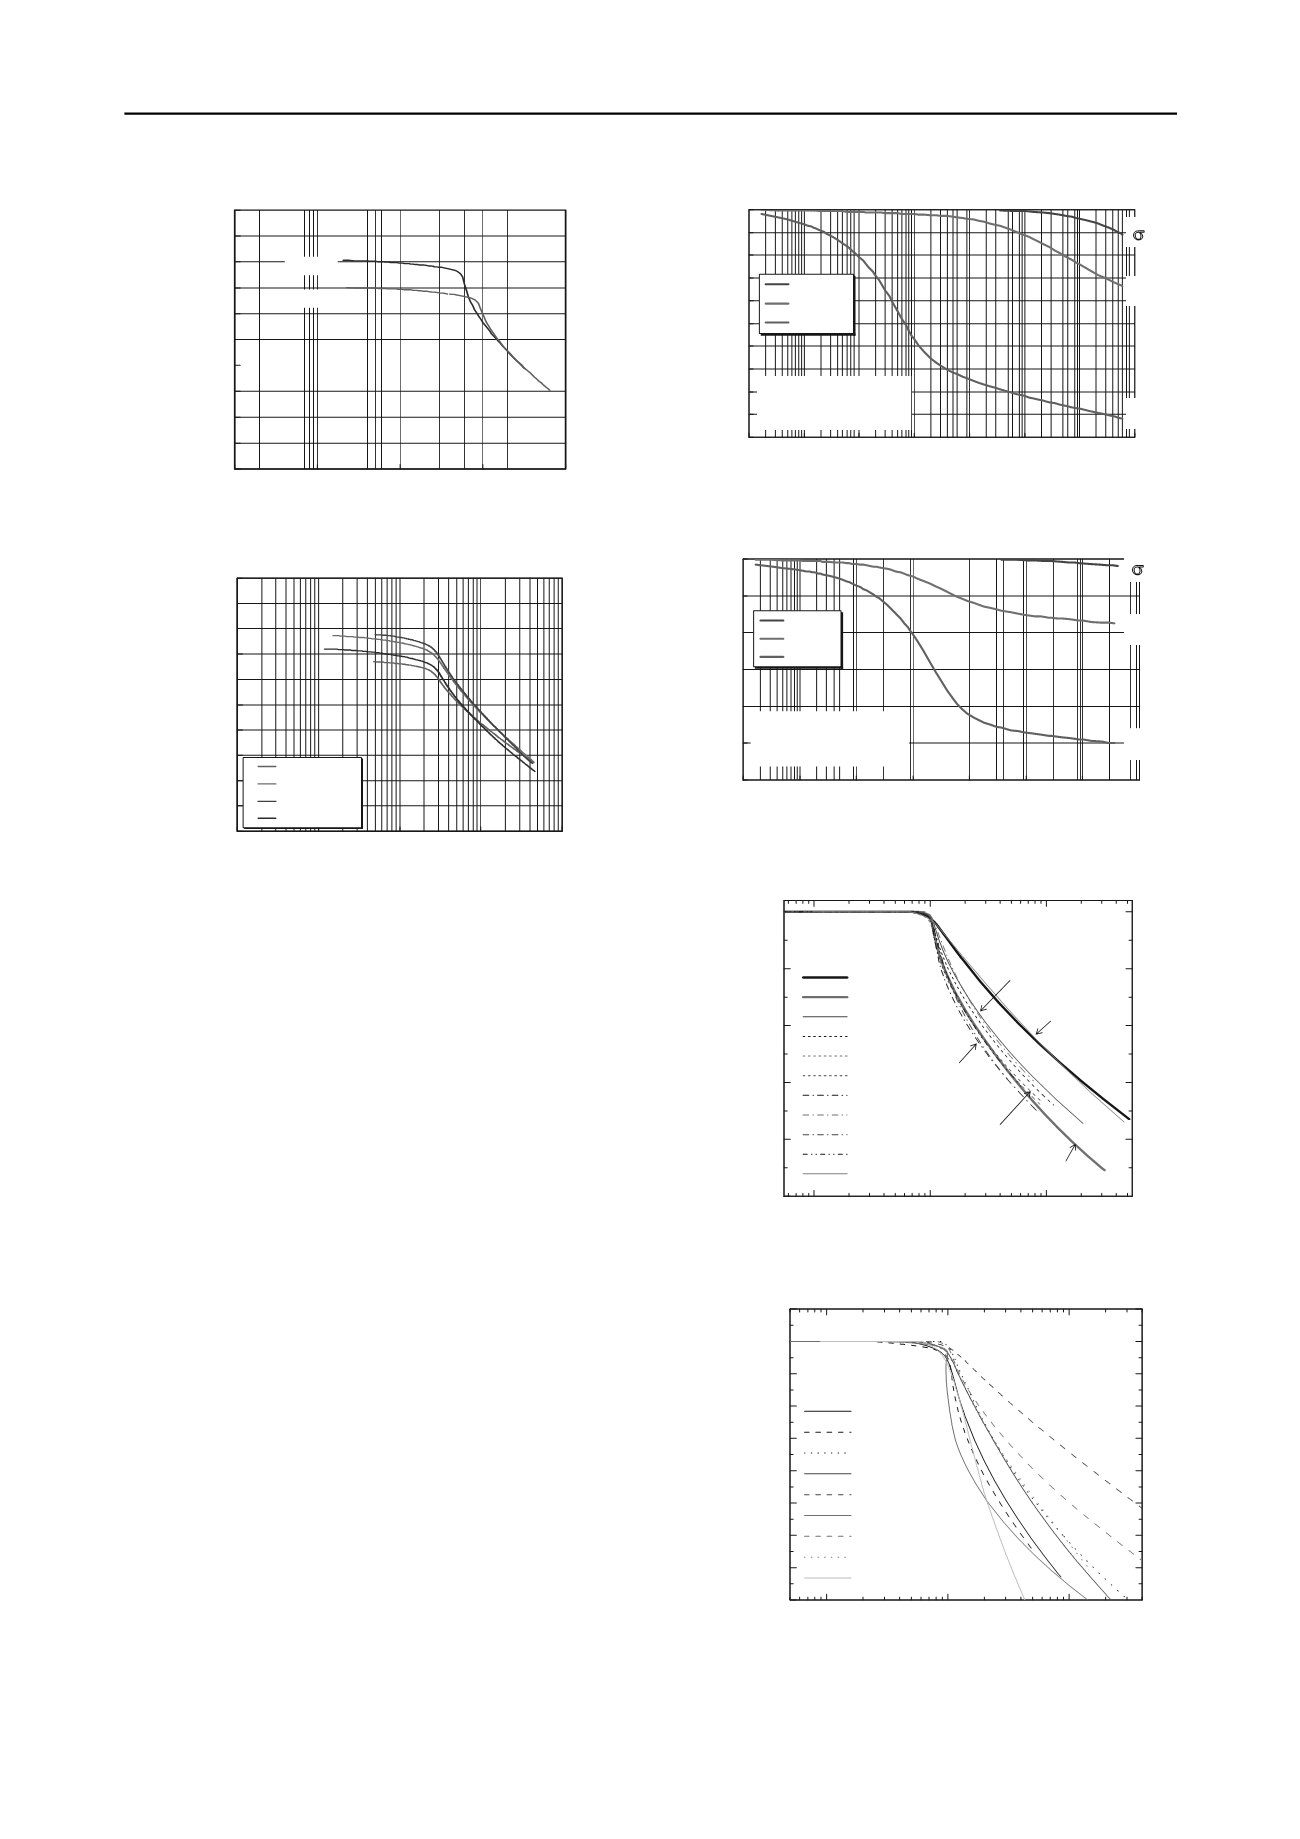
3 CONSOLIDATION TESTS
Compression curves (
e
–log
p
curves) for the two clays are
shown in Figure 3. Undisturbed samples collected from G.L.–76
and –101m (Ma11) for Osaka Bay clay and from G.L.–15.6 and
–17.6 m (B3) for Pisa clay were examined. Compression indices
C
c
at these two sites were commonly 0.7 with very similar
compressibility. Preconsolidation pressures
'
p
for Osaka Bay
clay and Pisa clay were 600–900 kN/m
2
and 250 kN/m
2
,
respectively. For these values, a common overconsolidation
ratio (OCR =
'
p
/
'
v0
) of approximately 1.4 were calculated
with the overburden effective stress
'
v0
of 750 kN/m
2
and 250
kN/m
2
, respectively.
In the long-term consolidation test, a specimen with 60 mm
in diameter and 20 mm in height was trimmed from an
undisturbed sample, then it was set in the oedometer with
double side drainage condition, then it was preliminary
consolidated by 24-h incremental loading up to the overburden
effective stress
'
v0
, and then a target pressure for the long-term
consolidation test was loaded (the overburden effective stress
'
v0
, preconsolidation pressure
'
p
, and twice of
preconsolidation pressure 2
'
p
). Consolidation curves observed
at the target pressures were drawn in Figure 4. In the case of
'
v0
, Osaka Bay clay shows significant delayed consolidation
with convex curve, which means that the secondary
consolidation index
C
gradually increases with time. Pisa clay,
however, shows concave curve, which means that the secondary
consolidation index
C
gradually decreases with time. In the
case of 2
'
p
, the both clays continuously shows the secondary
consolidation with concave curve after the primary
consolidation. In the case of
'
p
, observed behaviors for the two
clays were between the above two cases, respectively.
0
2
4
6
8
10
12
14
16
18
20
0.01 0.1
1
10 100 1000 10000 100000
Time
t
(min)
Strain
(%)
628 kPa
745 kPa
1569 kPa
'
v0
= 618 kPa
p
c
= 737 kPa
'
v0
p
c
2
p
c
'
v0
= 618 kPa
p
c
= 737 kPa
Figure 4a. Consolidation curves for the Osaka Bay clay.
0
2
4
6
8
10
12
0.01 0.1
1
10 100 1000 10000 100000
Time
t
(min)
Strain
(%)
177 kPa
265 kPa
530 kPa
'
v0
= 173 kPa
p
c
= 261 kPa
'
v0
p
c
2
p
c
0
= 173 kPa
c
= 261 kPa
Figure 4b. Consolidation curves for the Pisa clay.
0.1
1
10
0.5
0.4
0.3
0.2
0.1
0.0
Visco-plastic strain
vp
p
'/
p
'
c
Ma13
Ma12
Ma11
Ma10
Ma9
Ma8
Ma7a
Ma7b
Ma4
Ma3
Ma13Re
Ma12
Ma13
Ma13Re
Ma11
Ma7b
Ma10
Ma8
Ma9
Ma3
Ma7a
Ma4
Figure 5a. Reference compression curves for the Osaka Bay clays.
0.1
1
10
0.40
0.35
0.30
0.25
0.20
0.15
0.10
0.05
0.00
-0.05
Visco-plastic strain
vp
p'
/
p'
c
Amagasaki
Rakusai
Ariake
Upper Haneda
Lower Haneda
Louiseville
Onsoy
Pisa
Mexico City
1
2
3
4
5
6
7
8
9
1
2
3
4
5
6
7
9
8
Figure 5b. Reference compression curves for the worldwide clays.
EL.-76m
EL.-101m
0.0
0.2
0.4
0.6
0.8
1.0
1.2
1.4
1.6
1.8
2.0
1
10
100
1000 10000
Consolidation pressure
p
' (kPa)
Voidratio
e
Figure 3a. Compression curves for the Osaka Bay clay.
0.0
0.2
0.4
0.6
0.8
1.0
1.2
1.4
1.6
1.8
2.0
1
10
100
1000 10000
Consolidation pressure
p
(kPa)
Void ratio
e
15.6m
16.6m
17.6m
17.6m (0.01)
Figure 3b. Compression curves for the Pisa clays.


