447
Technical Committee 101 - Session II /
Comité technique 101 - Session II
3.3
Canadian clays
Depositional environments of the Canadian cemented clays
were described by Lefebvre et al. (1983), Tanaka et al. (2001b),
and Tanaka et al. (2003). Typical Canadian clays are of marine
origin, cemented and were lifted to the present elevation due to
the isostatic movement after the end of the Ice Age.
Overconsolidation ratios over 2 are believed to be a result of
cementation. Mineralogy of the Canadian quick clays can be
summarized as high amorphous minerals and abundant clay-size
rock flour (non-clay minerals).
3.4
Japanese clays
Most Japanese marine clays are characterized as non-glacial,
pyroclastic and low-swelling smectitic clays with clay fractions
of about 50%. A well-developed flocculated structure combined
with abundant fossil remains was mostly derived from diatoms
(Ohtsubo et al. 2000, Tanaka et al. 2001b, Tanaka et al. 2003).
Most of the Japanese marine clays have been developed since
8,000 years B.P., when the rapid sea-level rise commenced in
the late Quaternary era (Hanzawa and Tanaka 1992).
3.5
Asian clays
The Bangkok clay is a non-glacial, high-swelling smectite, non-
pyroclastic origin clay (Ohtsubo et al. 2000). Microfossils, such
as diatom or foraminifera are rare (Tanaka et al. 2001a). Clay
fractions of the Bangkok clay are typically over 50 %. The Iraqi
clays and the Korean marine clays in the database are with non-
swelling minerals, non-glacial origin, and non-pyroclastic.
Sedimentation time of Iraqi clays is about 5,000 years B.P.
(Hanzawa and Tanaka 1992). Depositional and post-
depositional environments of the Korean marine clays were
described in details by Won and Chang (2007). The Shihwa
clay is silt-dominant, whereas the Namak clay is clay-dominant.
4 DISCUSSION
Decades ago, Berre and Bjerrum (1973) and Ladd et al. (1977)
reported that anisotropy of clays decreases as plasticity index
(PI) increases. In other words, the anisotropic strength ratio
(K
s
=S
uE
/S
uC
) increases with PI. This trend was followed by
many researchers (for example, Mayne, 1983, Jamiolkowski et
al. 1985). Until Mayne (1983) compiled 66 anisotropic data
points, the trend was supported only by 16 data points including
4 plane strain data and 12 triaxial data on undisturbed or
resedimented samples, mainly from Scandinavian clays and a
mixture of recompression and SHANSEP approaches. In the
meantime, 53 resources compiled by Mayne (1983) included
test results from different conditions and test methods, such as
quick sand, remolded specimens, overconsolidated soils, and
unconfined compression tests on different trimming angles.
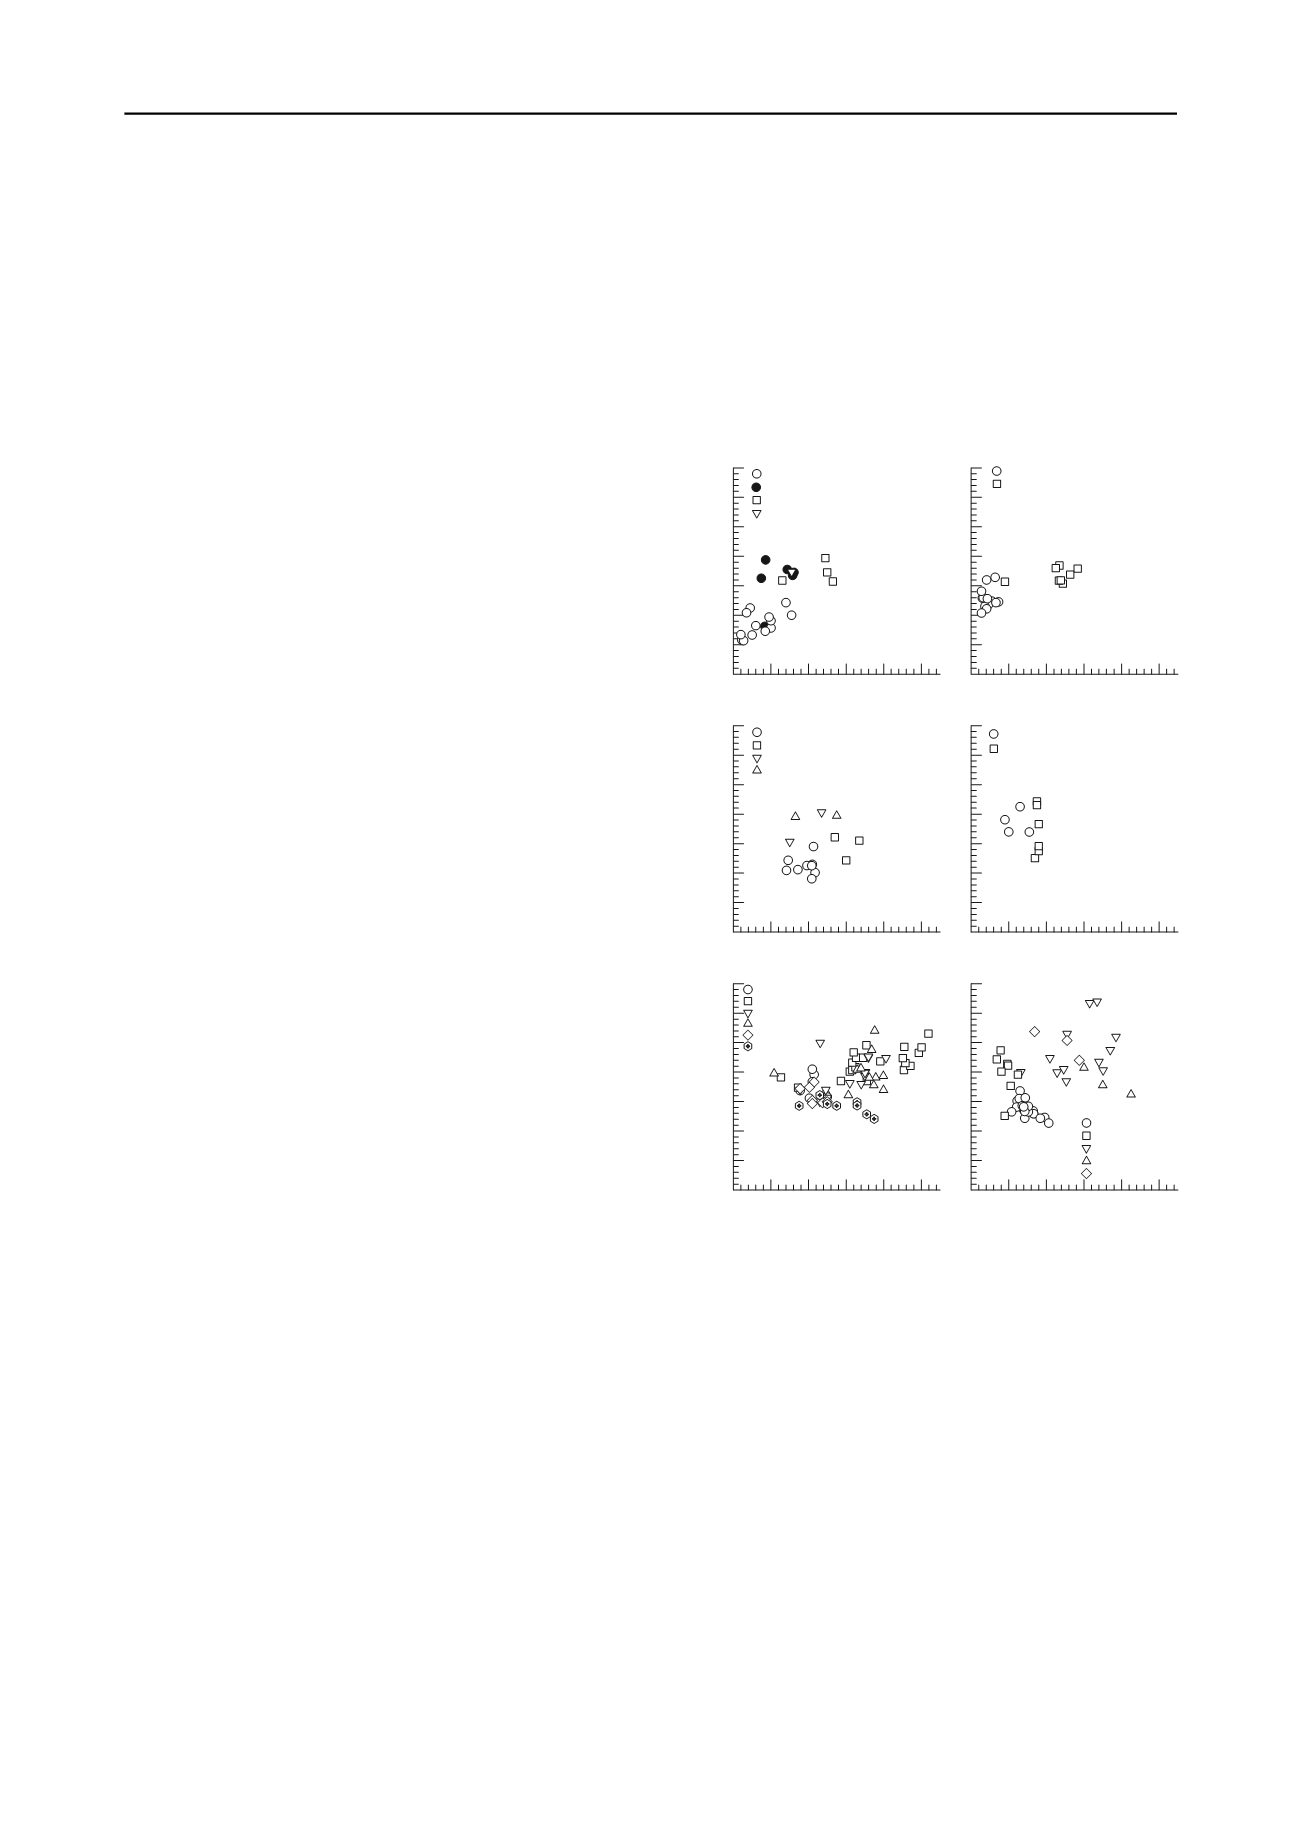
In this study, anisotropic data following the data selection
criteria are grouped into their regions and depositional
environments (Figure 2). If all the data are plotted in one space,
the trend can be biased by the dominant number of test sets, for
example Japanese clays. Furthermore, one can treat different
clays with the same PI as the similar clays, even though they
have different mineralogy, clay structures, and clay fractions,
i.e. different deposition environments. Anisotropic strength
ratios of the Scandinavian clays in Figure 2(a) show a wide
spread within a small range of PI. Anisotropy data for the
Scandinavian clays reported by Berre (1982) and Berre and
Bjerrum (1973) were based on failure definition-A. Since the
Drammen clay typically shows strain hardening behavior and
does not have peak extension strengths (Berre and Bjerrum
1973, Ladd et al. 1977, Hanzawa and Tanaka 1992), the
extension strengths by definition-A resulted in much less K
s
than ones by definition-B. In fact, Ladd et al. (1977) and Berre
(1982) have mentioned that extension strengths determined by
the definition-A can be somewhat too low; hence the K
s
values
for the Norwegian low PI clays reported by Berre (1982) and
Berre and Bjerrum (1973) must have been underestimated.
Moreover, Tanaka and Tanaka (1997) have reported anisotropy
data for the Drammen clay (filled circles in Figure 2(a)), which
were quite different from the results by Berre and Bjerrum
(1973). Tanaka and Tanaka (1997) reported K
s
ranging 0.32-
0.78 for PI=15-32, whereas the range of K
s
was 0.265-0.4 by
Berre and Bjerrum (1973) for the same lean and plastic
Drammen clays. Tanaka and Tanaka (1997) must have followed
the failure definition-B. If the anisotropy data for Scandinavian
clays were based on the failure definition-B at the beginning,
the anisotropy trend with PI would have been quite different.
Plasticity index, PI (%)
0 20 40 60 80 100
K
s
= S
uE
/ S
uC
0.0
0.2
0.4
0.6
0.8
1.0
1.2
1.4
Plasticity index, PI (%)
0 20 40 60 80 100
K
s
= S
uE
/ S
uC
0.0
0.2
0.4
0.6
0.8
1.0
1.2
1.4
Plasticity index, PI (%)
0 20 40 60 80 100
0.0
0.2
0.4
0.6
0.8
1.0
1.2
1.4
Plasticity index, PI (%)
0 20 40 60 80 100
0.0
0.2
0.4
0.6
0.8
1.0
1.2
1.4
Plasticity index, PI (%)
0 20 40 60 80 100
K
s
= S
uE
/ S
uC
0.0
0.2
0.4
0.6
0.8
1.0
1.2
1.4
Plasticity index, PI (%)
0 20 40 60 80 100
0.0
0.2
0.4
0.6
0.8
1.0
1.2
1.4
(a) Scandinavian clays
(c) European and
Gulf of Mexico clays
(b) Canadian clays
(e) Japanese clays
(f) East Asian clays
(d) Middle-East clays
Iraq: Fao
Iraq: Khor Al-Zubaire
United Kingdom
France
Italy
USA: Gulf of Mexico
Korea: Namak
Thailand
Korea: Shihwa
Indonesia
Singapore
NBR site
Other sites
Norway: Definition-A
Sweden
Finland
Norway: Definition-B
Other sites
Osaka bay
Izumo
Ariake
Kinkai
Tokyo bay
Figure 2. Anisotropic strength ratio versus plasticity index for different
depositional environments.
For Canadian clays in Figure 2(b), the published data can be
grouped into (1) low PI, sensitive and highly structured clays,
and (2) structured clays with high PI. The majority of the low PI
group are of the NBR site (Lefebvre et al. 1983), where an
intensive test program has been performed on the marine clay
with PI=5-15. Among the anisotropy data from the NBR site,
only the data that satisfied the data selection criteria are
presented. The failure definition-B (necking failure) was used
for the NBR site. The K
s
values in the NBR site varied between
0.41-0.66, depending significantly on the degrees of structure,
within a narrow PI range. The majority of the high PI group
data are from the Champlain Sea area. The difference between
the low and the high PI groups seems to be originated from
mineralogy of the clay size particles; the low PI clays consist of
rock flour for clay-size particles, whereas the high PI clays
consist of illite, chlorite, and vermiculite (Tanaka et al. 2001b).
Distinctively different characteristics of the two groups make it
difficult to draw a trend line for the Canadian clays.
Anisotropic data from Gulf of Mexico and the data of
European clays are plotted together in Figure 2(c) because their
depositional environments seem to be similar. Anisotropic


