455
Technical Committee 101 - Session II /
Comité technique 101 - Session II
4 LABORATORY TEST
From the on-board test results and the measurement of gas
concentrations, it was guessed that the strength of samples
retrieved from GH-bearing ground is decreased by the sample
disturbance due to the exsolution of dissolved gas during the
sampling. In order to clarify this, the strength change by the
sample disturbance due to the exsolution of dissolved gas in the
pore water was evaluated by the laboratory tests which simulate
the stress relief from bringing the samples to the lake surface.
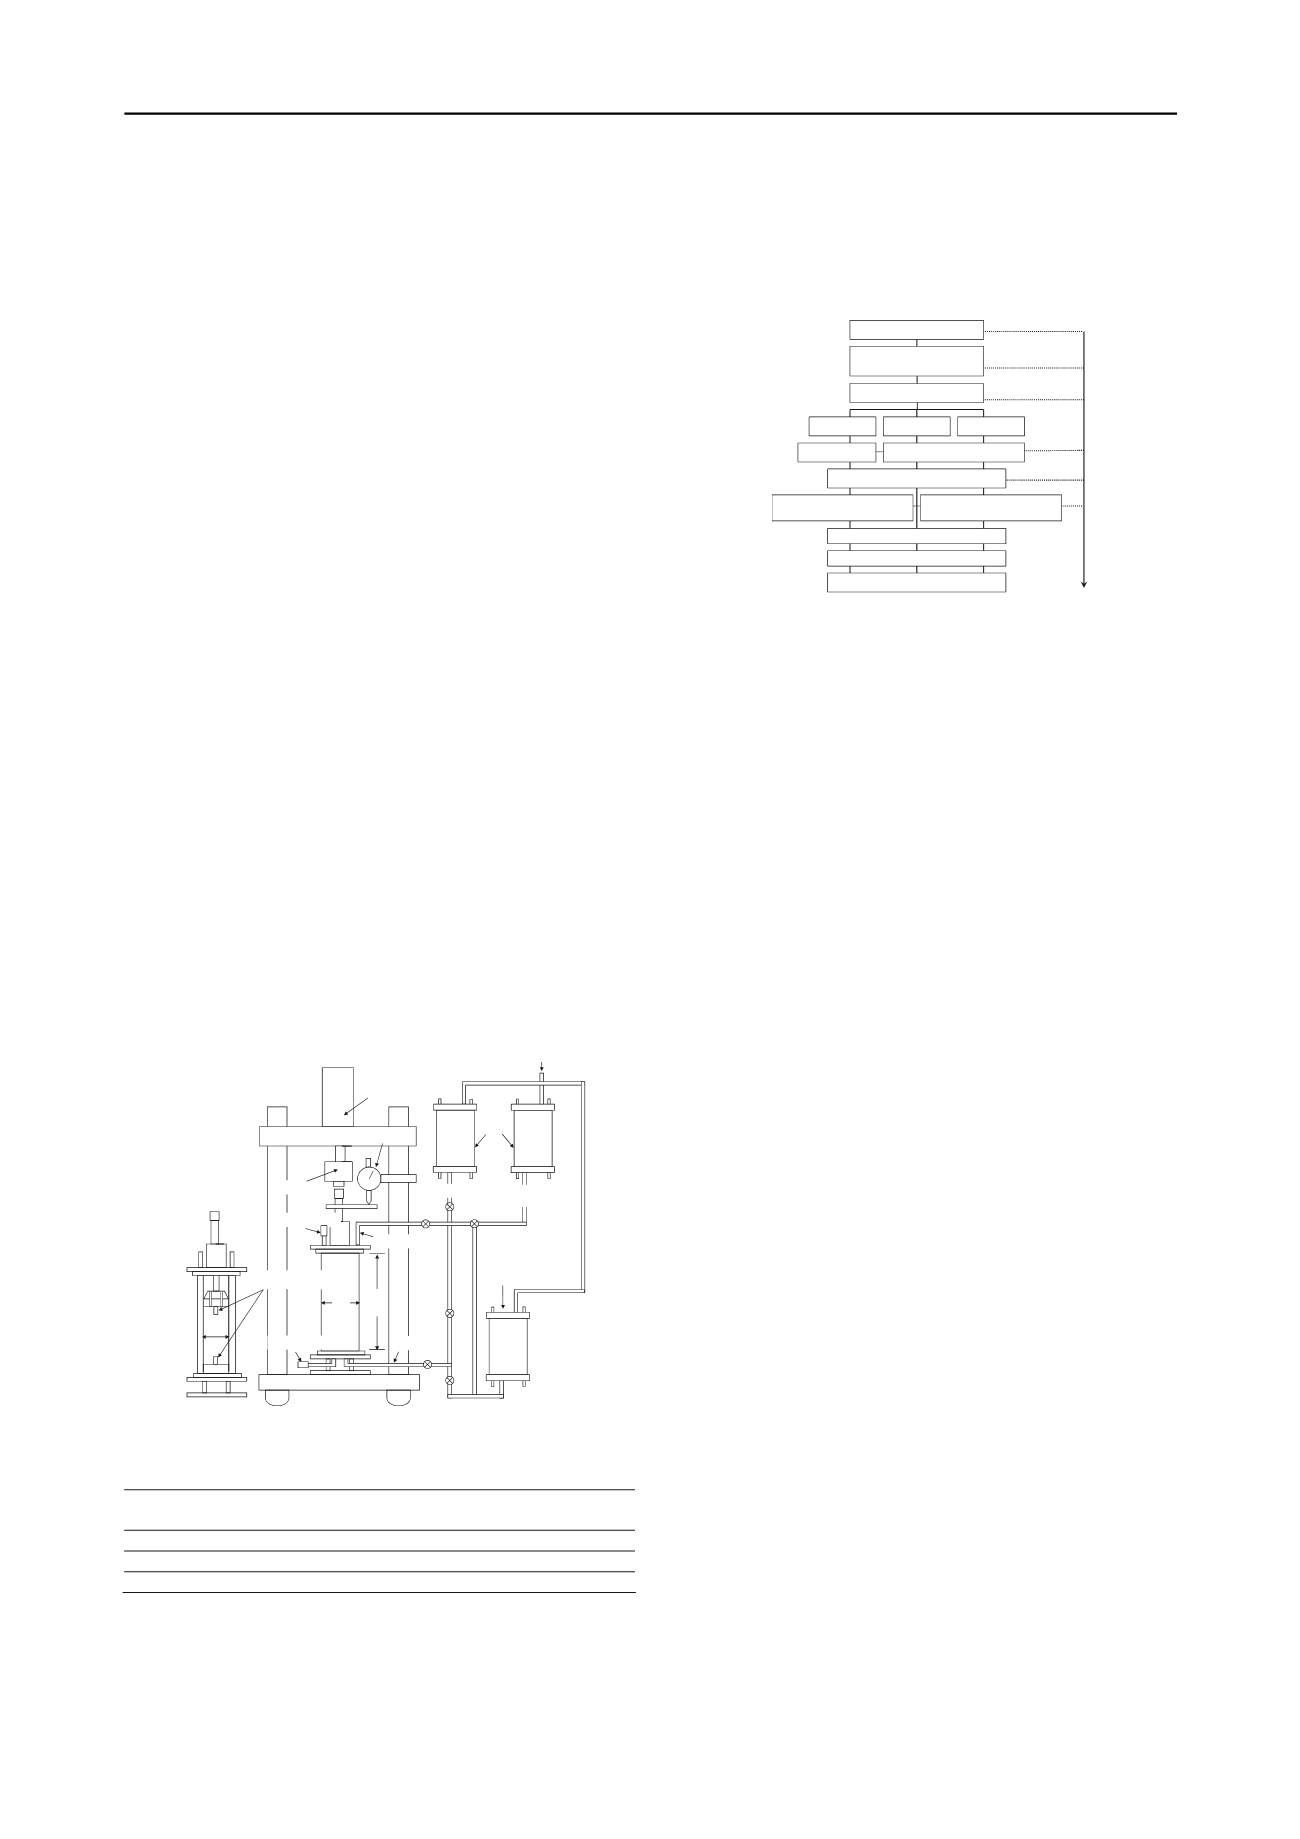
4.1 Test apparatus and test method
Figure 5 illustrates the oedometer apparatus using the
simulating laboratory test. Used sample is a mixed Baikal lake-
bottom sediment (
s
= 2.720 g/cm
3
,
w
L
= 70.1 %,
I
p
= 41.9, clay
content is 58 %, silt content is 40 %, sand content is 2 %)
retrieved from the Kukuy site at 2005 and 2006 (Kataoka et al.
2009). The mixed sample is slurry state having an initial water
content of 1.6 times the liquid limit. Used gas is carbon dioxide
(CO
2
) instead of methane (CH
4
), because CO
2
gas has high
solubility in comparison with CH
4
gas. For example, the
solubility of CH
4
gas under water temperature of four degrees
centigrade and water depth of 1000 m is almost same to that of
CO
2
gas under water temperature of 20 degrees and back water
pressure of 500 kPa.
The laboratory tests were conducted on three test conditions
as shown in Table 1 and Figure 6. The consolidation time is 24
hours for each consolidation stage of 20, 50, and 100 kPa. The
back pressure was applied after end of consolidation of 20 kPa.
In the case of Test Case 1, the back pressure of 500 kPa was
applied by air pressure. On the other hand, in the cases of Test
Case 2 and 3, the back pressure was applied by CO
2
gas
pressure. The back pressures of Case 2 and 3 were 100, 300 and
500 kPa, respectively. In the Case 1, deaired water was
permeated through the sample after end of consolidation of 100
kPa. In the Case 2 and 3, CO
2
gas dissolved water was
permeated. The permeated time is 10 days. The volume of
permeated water is similar to the volume of sample.
unit: mm
B.P. route
B.P. route
Pressure meter
330
120
Load cell
Dial gauge
Pressure meter
Bellofram cylinder
Pressure chamber
Deaired water Dissolved
gas water
Oedometer cell
Bender elements
70
CO
2
Figure 5. Schematic diagram of laboratory test apparatus.
Table 1. Test conditions.
Test
Case
Consolidation
stress (C.S.) (kPa)
Back pressure
(B.P.) (kPa)
C.S. at B.P.
reduction (kPa)
1
100
500
20
2
100
100, 300, 500
100
3
100
100, 300, 500
20
Thereafter, in the Case 2, the back pressure was decreased to
atmospheric pressure under a consolidation stress of 100 kPa.
On the other hand, in the Case 1 and 3, it was decreased after
the consolidation stress was decreased to 20 kPa. Therefore, it
would seem that the effects of the sample disturbance in Case 3
are larger than those in Case 2, because the vertical stress of
Case 3 at stress release is lower than that of Case 2.
Unconfined compression tests (sample diameter is 50 mm,
height is 100 mm, loading rate is 1 mm/min) were performed on
the specimens prepared by above procedure.
Consolidation: 20 kPa
B.P.: 100 - 500 kPa
Consolidation: 50 kPa
Case 1
Consolidation: 100 kPa
Case 2
Case 3
Deaired water
Dissolved CO
2
gas water
Decrease of Consolidation
stress to 20kPa
Reduce of B.P. to 0 kPa
Decrease of Consolidation
stress to 20kPa
Unconfined compression test
Stop of percolation
24h
24h
24h
10days
24h
Remove of vertical stress
Figure 6. Test process of laboratory test.
4.2 Unconfined compression test results
Figure 7 shows the stress strain relations of unconfined
compression tests on all specimens. Figure 8 shows the relations
between the unconfined compression strength and the back
pressure at consolidation. It is found that the strengths in Case 2
and 3 permeated CO
2
gas dissolved water are lower than those
in Case 1 permeated deaired water. It is also found that the
strengths in Case 2 and 3 decrease with the increase of back
pressure.
Figure 9 shows the relations between the deformation
modulus,
E
50
, and the back pressure. Although
E
50
in Case 2
and 3 on back pressure of 100 kPa has some scatter because the
degree of CO
2
gas dissolution is low,
E
50
decreases with the
increase of back pressure due to the exsolution of dissolved gas
in the pore water in the case of the back pressure of 300 and 500
kPa. However, the strengths in Case 3 had not become lower
than those in Case 2.
Figure 10 shows the typical time histories of vertical stress,
back pressure and axial displacement during the stress release. It
is found that the change of axial displacement is not recognized
during the decrease of vertical stress and back pressure in all
test cases. On the other hand, the axial displacement increases
after the release of vertical stress and back pressure in the Case
3. Although the data recording is stopped halfway in the Case 2,
the increase of axial displacement was recognized after the
release of vertical stress and back pressure. Therefore, it would
seem that the difference of strength between the Case 2 and the
Case 3 is not recognized, because the sample disturbance was
produced after the stress release. It is said that the occurrence of
the sample disturbance with the swelling or cracking was
delayed by the effect of the cohesion of sample having much
clay content. In actuality, when the sampling core was retrieved
from the deep lake bottom, the swelling or cracking of core
surface is observed after the time of some extent passed. Thus,
it is found that the strength of sample becomes low due to the
effect of the exsolution of dissolved gas on both on-board and
laboratory tests.
Next, the relations between the reduction of strength and the
water depth (pressure) are compared. Figure 11 shows the
relations between the strength ratio of Case 1 to Case 2, 3 and
the water depth converted the solubility of CO
2
gas into that of
CH
4
gas. In this figure, unconfined compression test results
using the intact samples retrieved from the Lake Baikal
(Kataoka et al. 2009) and the triaxial compression test results
using intact Liestranda and Bothkennar clays (Lunne et al.
2001) were also plotted.
Test results of Kataoka et al. (2009) are for samples retrieved
from the different water depth areas in the Lake Baikal, and the
strength ratio is average value of the mud volcano samples


