462
Proceedings of the 18
th
International Conference on Soil Mechanics and Geotechnical Engineering, Paris 2013
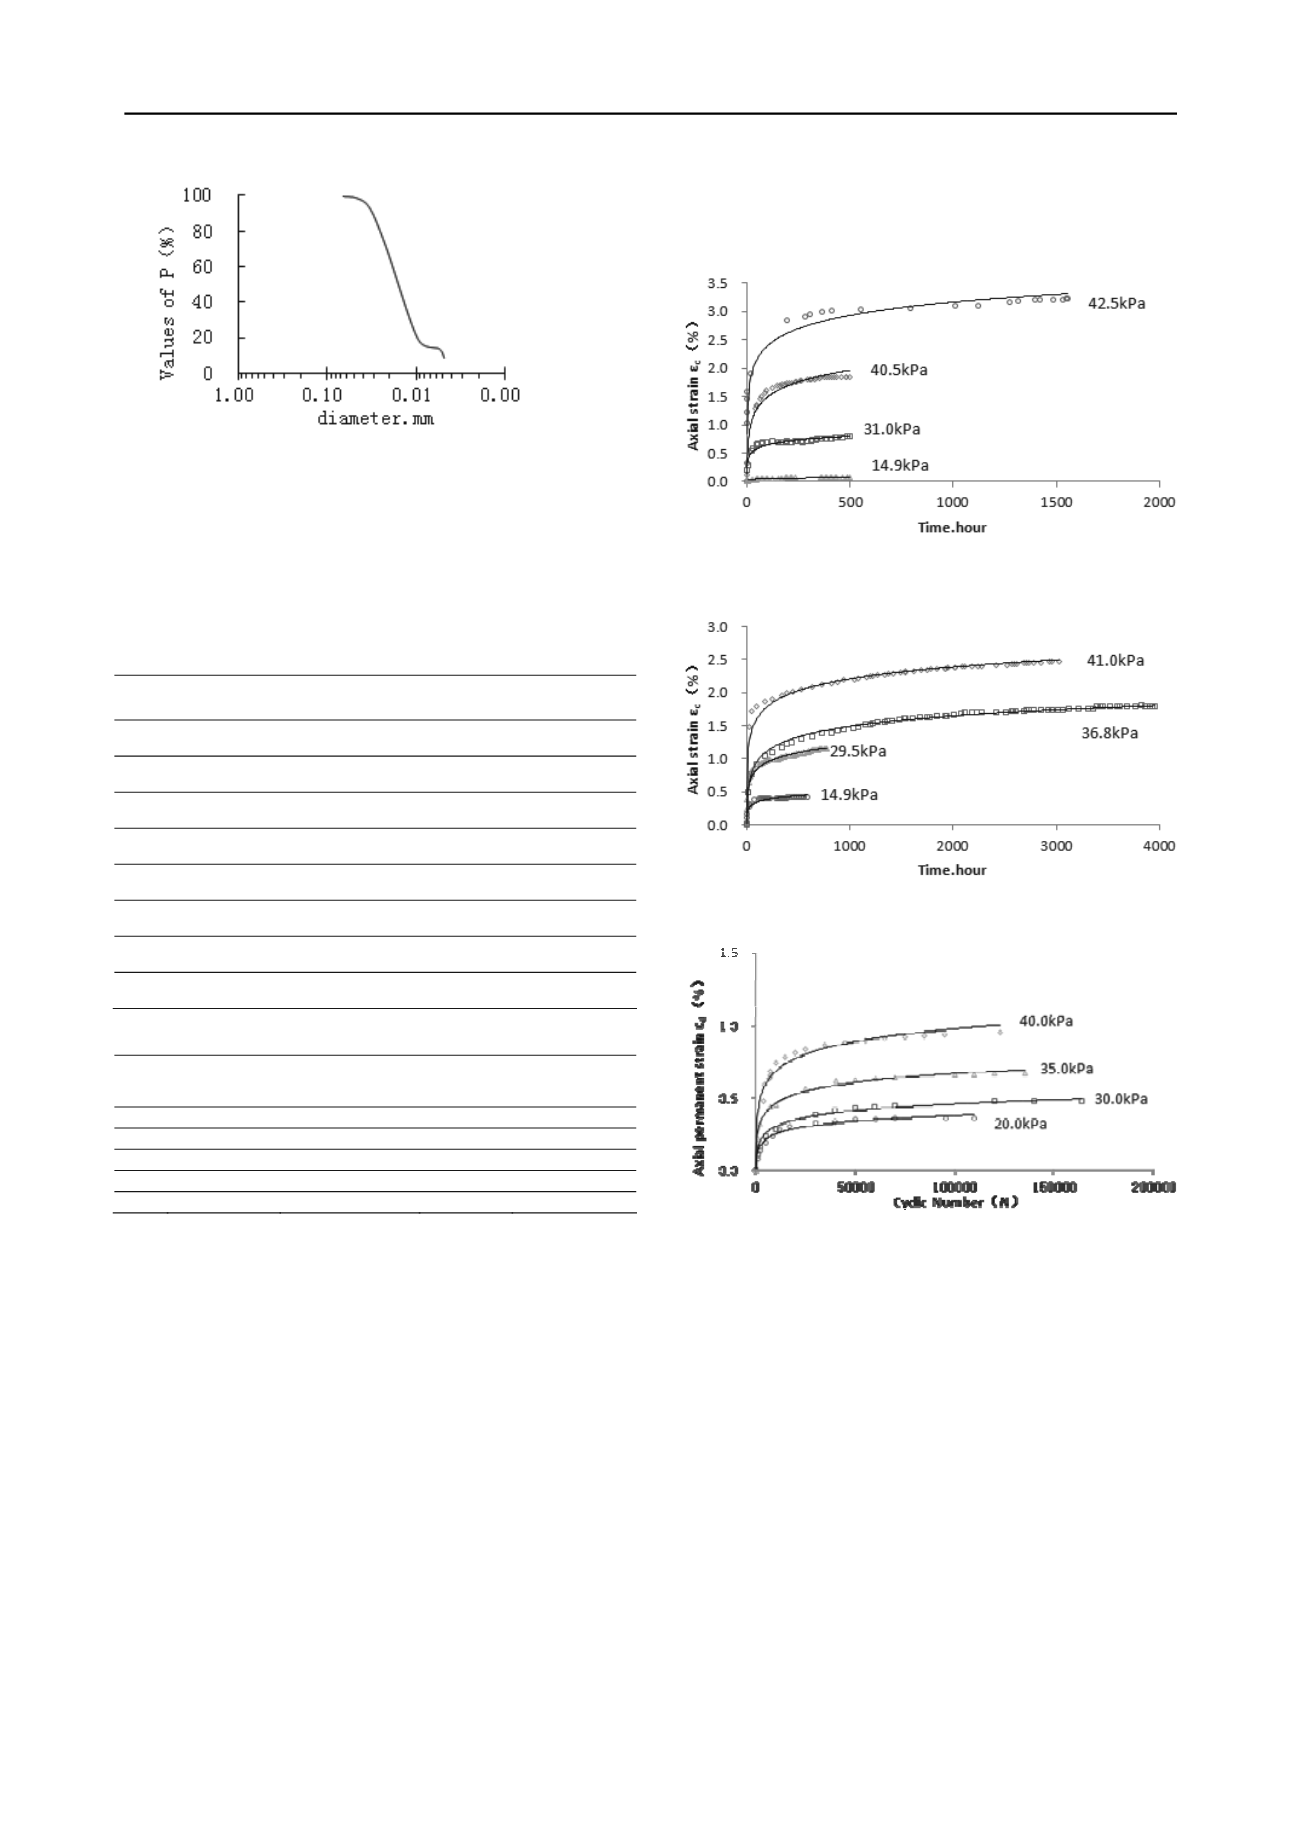
Figure 1. Semilogarithmic plot of results of grain analysis
Note: P means percentage by weight of grains smaller than the denoted
size.
Creep test and dynamic triaxial test samples parameters can
be seen in Table 3 and Table 4. The drained and undrained
strength were 52.0kPa and 38.9kPa respectively under 50kPa
chamber pressure.
Table 2. creep test samples index
No
Drainage
lines
Deviator stress
(kPa)
Density
(
g/cm
3
)
Water content
(
%
)
1
open
14.9
1.81
39.2
2
open
29.5
1.79
39.6
3
open
36.8
1.81
40.1
4
open
41.0
1.81
39.7
5
closed
14.9
1.85
39.8
6
closed
31.0
1.82
42.3
7
closed
40.5
1.84
42.3
8
closed
42.5
1.83
41.9
Table 3.. Dynamic triaxial test samples index
No.
Drainage
lines
Deviator stress
σ
d
(kPa)
Density
(
g/cm
3
)
Water content
(
%
)
1
closed
20.0
1.80
42.1
2
closed
30.0
1.81
42.1
3
closed
35.0
1.80
43.0
4
closed
40.0
1.82
39.7
5
closed
45.0
1.81
40.7
2.2
Test results analysis
In creep test axial strain is generally denoted as the function
stress level and time, for example . Exponential or hyperbolic
function is used to express the influence of stress level. Power,
logarithm or hyperbolic function is used to express the influence
of time(Singh A. and Mitchell J.K. 1968, Mesri G. and Rebres-
Cordero E. 1981, Wang BinWang ChangMingand Zhang
Xianwei et al,2008, Zhang Wang 2009). It can be seen that
logarithm function is reasonable for the correlation between
strain and time (see Figure 3 and Figure 4). In Figure 3 and
Figure 4 the origin is the deformation of 1h. Test data is
expressed in the form of the dots of all kinds of shapes. The
logarithm fitting curves are the black solid line.
The samples used to creep and cyclic triaxial test were
prepared as follows: Clay with moisture content over liquid
limit was consolidated under certain load until 50kPa. That can
ensure soil with the same stress history and the same
consistency. The samples (Φ39.1 (mm) × H80 (mm) used to
creep test and Φ50 (mm) × H100 (mm) used to dynamic triaxial
test) were consolidated isotropically in chamber under 50kPa.
The chamber pressure during test is 50kPa. Creep soil samples
were sheared by respective loading in triaxial creep apparatus
under drained and undrained condition. Dynamic triaxial test
samples were sheared under undrained and 5Hz condition.
Figure 2. Undrained Creep Curve
Figure 3. Drained Creep Curve
x
Figure 4. Dynamic Triaxial Test Curve
In this dynamic triaxial test logarithm function is used to
express the correlation between axial strain and time.
is
used to express the correlation between axial strain and stress
level, (see Eq. 1).
)(
Df
ε
d
=f(D)lnN
(1)
ε
d
——axial strain in dynamic triaxial test;
D=σ
d
/σ
3
,
σ
d
——deviator stress, σ
3
——chamber stress.
A fitted coefficient under every stress level can be obtained
by fitting the test data. f(D) can be solved by analyzing the
correlation between the coefficient and stress level.
ε
d
=0.022e
2.04D
lnN
(2)
Because of the similarity between creep deformation and
permanent deformation in dynamic triaxial test, it is raised that
the stress-strain-cyclic number formula in dynamic triaxial test
can be used to predict the creep deformation. In order to depict
the influence on the difference between static and dynamic load
and drainage condition, firstly
ψ
(D
r
) is introduced.


