467
Technical Committee 101 - Session II /
Comité technique 101 - Session II
The yield function in a
p,q
-plane is
2
2
0
(
)
f q M p p p
0
(
13
)
An associate flow rule is assumed, i.e., and the plastic potential
g = f =
0
.
0
0.1 0.2 0.3 0.4 0.5 0.6
0
100
200
300
400
500
600
700
Ice Ratio (e
i
)
Preconsolidation Stress p
0
f
(kPa)
p
0
=60kPa
p
0
=100kPa
p
0
=150kPa
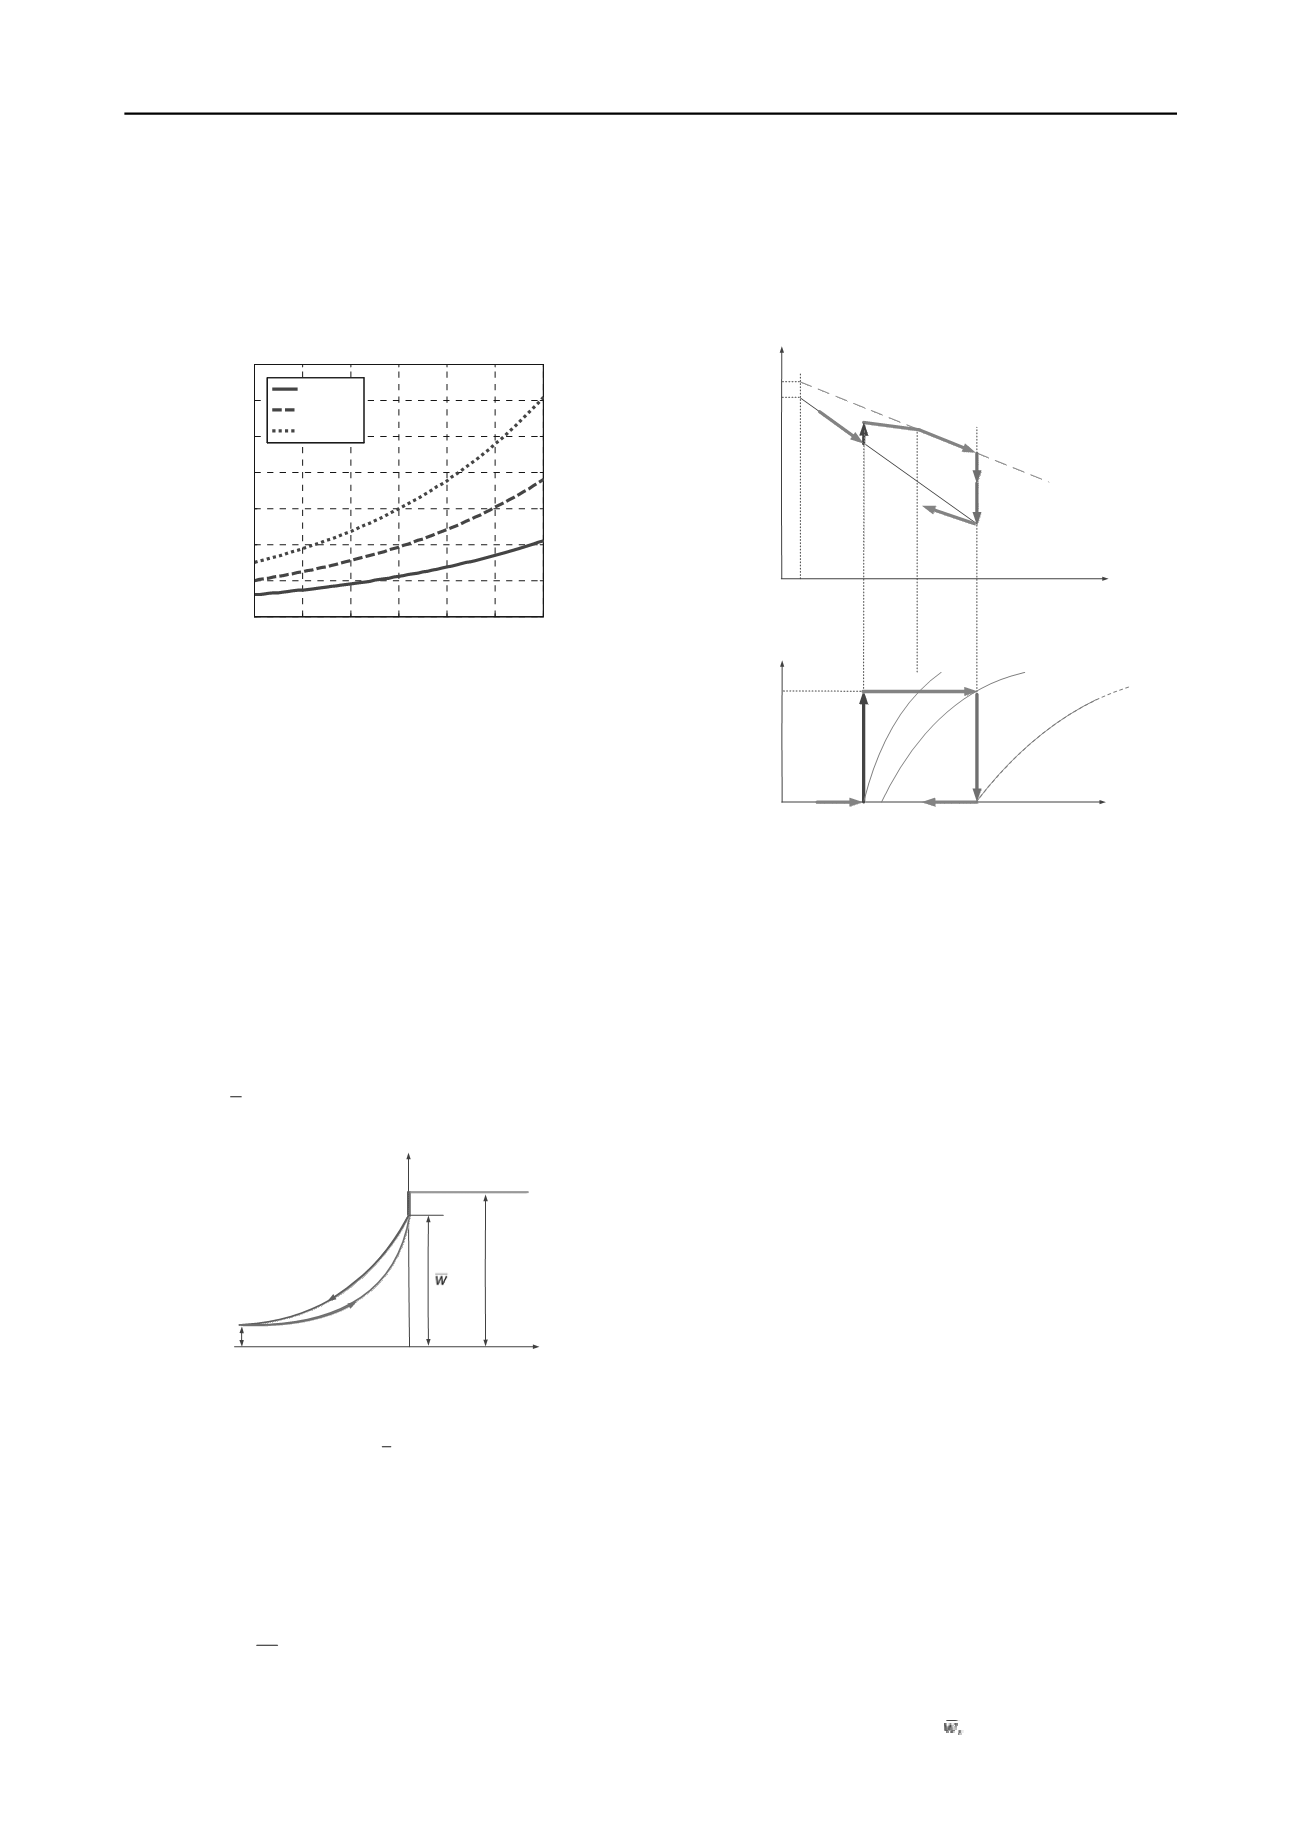
Figure 2 Yield stress for frozen soil with different ice ratio
i
e
Thawing of a frozen soil will decrease the amount of ice in its
pores, reducing “ice cementation” and consequently, reducing
strength. For non-segregation frozen soils, the strength after
complete thawing tends to move back to the same envelope as
before freezing. There will be no further weakening since no
thermally induced mass migration occurred during freezing, and
the change of the soil fabric during the thermal process is not
significant.
2.2
Unfrozen water content
The unfrozen water curve can be used to identify the amount of
pore ice formed during freezing. In most of the soils other than
coarse granular ones, not all water freezes at the freezing point.
A 3-parameter function (Michalowski and Zhu, 2006) was
developed to describe the unfrozen water content for most soils
(see Figure 3). This function has the following form:
0
(
)
*
*
(
)
a T T
w w w w e
(
14
)
w
T
0
T
*
w
0
w
Figure 3 Unfrozen water content curve
At freezing point
T
0
, a portion of the water freezes and the
rest remains in the liquid state (
w
). The liquid moisture content
reduces with the decrease in the temperature to reach
at
some low reference temperature. Parameter describes this
reduction rate.
*
w
a
The ice ratio can be calculated from the unfrozen water
content as
i
e
0
(
)
1.09
s
i
w
e w w
(
15
)
3 THERMAL-MECHANICAL LOADING PROCESS
To better illustrate the model, a freeze-thaw cycle along with an
external load applied is shown in Figure 4. The thermal process
is depicted with the blue (freezing) and red (thawing) lines,
whereas the loading-unloading is depicted by the green lines.
A
B
C
D
E
O
ln
p
0
r
p
i
e
ln
p
iC
e
F
0
B
p
( )
0
C D
p
0
E
p
G
1
A
1
B
1
C
1
D
1
E
1
F
1
G
0
f
0
Figure 4 Freeze-thaw cycle and load path with corresponding yield
curves
A saturated soil specimen is preconsolidated under isotropic
compression from point A to B. Then, under constant stress, the
freezing process takes place (B-C), and the ice ratio at point C is
. In this process, the isotropic yield stress (apparent
preconsolidation stress for corresponding frozen soil) increases
from B
1
to D
1
following equation (7)
iC
e
, and it has a value of
0
D
p
at
point D
1
(the soil has the same apparent preconsolidation stress
after it had been frozen at point C
1
). The below-freezing
temperature is then maintained, and isotropic compression is
increased to reach the normal compression line for frozen soil at
pressure
0
D
p
; the load is then continued along the NCL to reach
0
E
p
. During this loading, the void ratio is changing while the
ice ratio remains constant. This is based on an assumption that
ice and soil skeleton are both incompressible. From C to D, the
frozen soil experiences elastic behavior, whereas from D to E it
behaves plastically.
e
Thereafter, the soil is thawed at constant stress
0
E
p
. Once ice
starts melting, the soil can no longer sustain load
0
E
p p
, and
the process of consolidation will start, moving the soil to the
normal compression line for the unfrozen soil (point F).
Unloading from F results in an elastic rebound along the URL
for unfrozen soil to G.
4 APPLICATION AND FINAL REMARKS
The constitutive model was implemented into the FE system
ABAQUS using subroutine UMAT and UEXPAN to solve
boundary value problems. A soil column subjected to both the
mechanical load and a thermal process was simulated.
The parameters and initial values used in the simulation are
listed in Table 1.
λ
and
κ
are the slopes for NCL and URL in
compression plane.
M
is the slope of the critical state line in
p
-
q
space.
p
0
and
e
0
are the initial values for the pre-consolidation
pressure and the void ratio. w*, and are parameters for
a


