476
Proceedings of the 18
th
International Conference on Soil Mechanics and Geotechnical Engineering, Paris 2013
Proceedings of the 18
th
International Conference on Soil Mechanics and Geotechnical Engineering, Paris 2013
function of ε, and similarly the secant modulus G
s
. The authors
affirmed that their variation can be well compared with those
given by the usual hyperbolic model, except for cases with very
small initial strains. They concluded that the results are similar
to those obtained by laboratory tests and geophysical surveys.
Benz´s et al.
paper presents the recent developments
achieved on the Panda 3
®
dynamic penetrometer to improve its
use for site characterization. This new improvement is
schematically represented in Figure 9 including a typical test
result. According to the authors the load-settlement
p
-s
p
curve
can be derived from the measurement and decoupling of sonic
waves created by each impact of the penetrometer, which allows
the determination of the strength and deformation parameters.
The paper presented calibration chamber test data for two
different soils to validate the given results. It was observed a
good repeatability and sensibility to the soil conditions. The
authors compared the results with those obtained by triaxial and
oedometer tests and also found a good agreement for sands.
This new test is now currently used in the field to improve the
derivation of geotechnical soil parameters via site derived load-
settlement Panda curves.
Figure 9. Schematic representation of Panda 3
®
dynamic penetrometer
with a typical test result (
Benz et al
).
The paper from
Nishimura et al.
presents the use of the
Swedish Weight Sounding (SWS) test with the objective of
making a diagnosis of man made earth-fills, hence increasing
their lifetime – especially because their shear strength is
generally required for investigations with this scope. The study
is justified by the existence of several earth-fill dams for farm
ponds in Japan, with some of them under final life stages.
Although the strength can also be predicted by the SPT N-
values, the authors used the SWS test as a simple method for
obtaining the spatial distribution of the N-values in short
interval exams. The paper also presented an indicator simulation
(geostatistical) method to interpolate the spatial distribution of
derived N-values. The results are used to determine degraded
regions within existing embankments. The shear strength
parameter was derived through the empirical correlation with
the N-values, and the reliability analysis of the embankments
was conducted considering the variability of the internal friction
angle of the material.
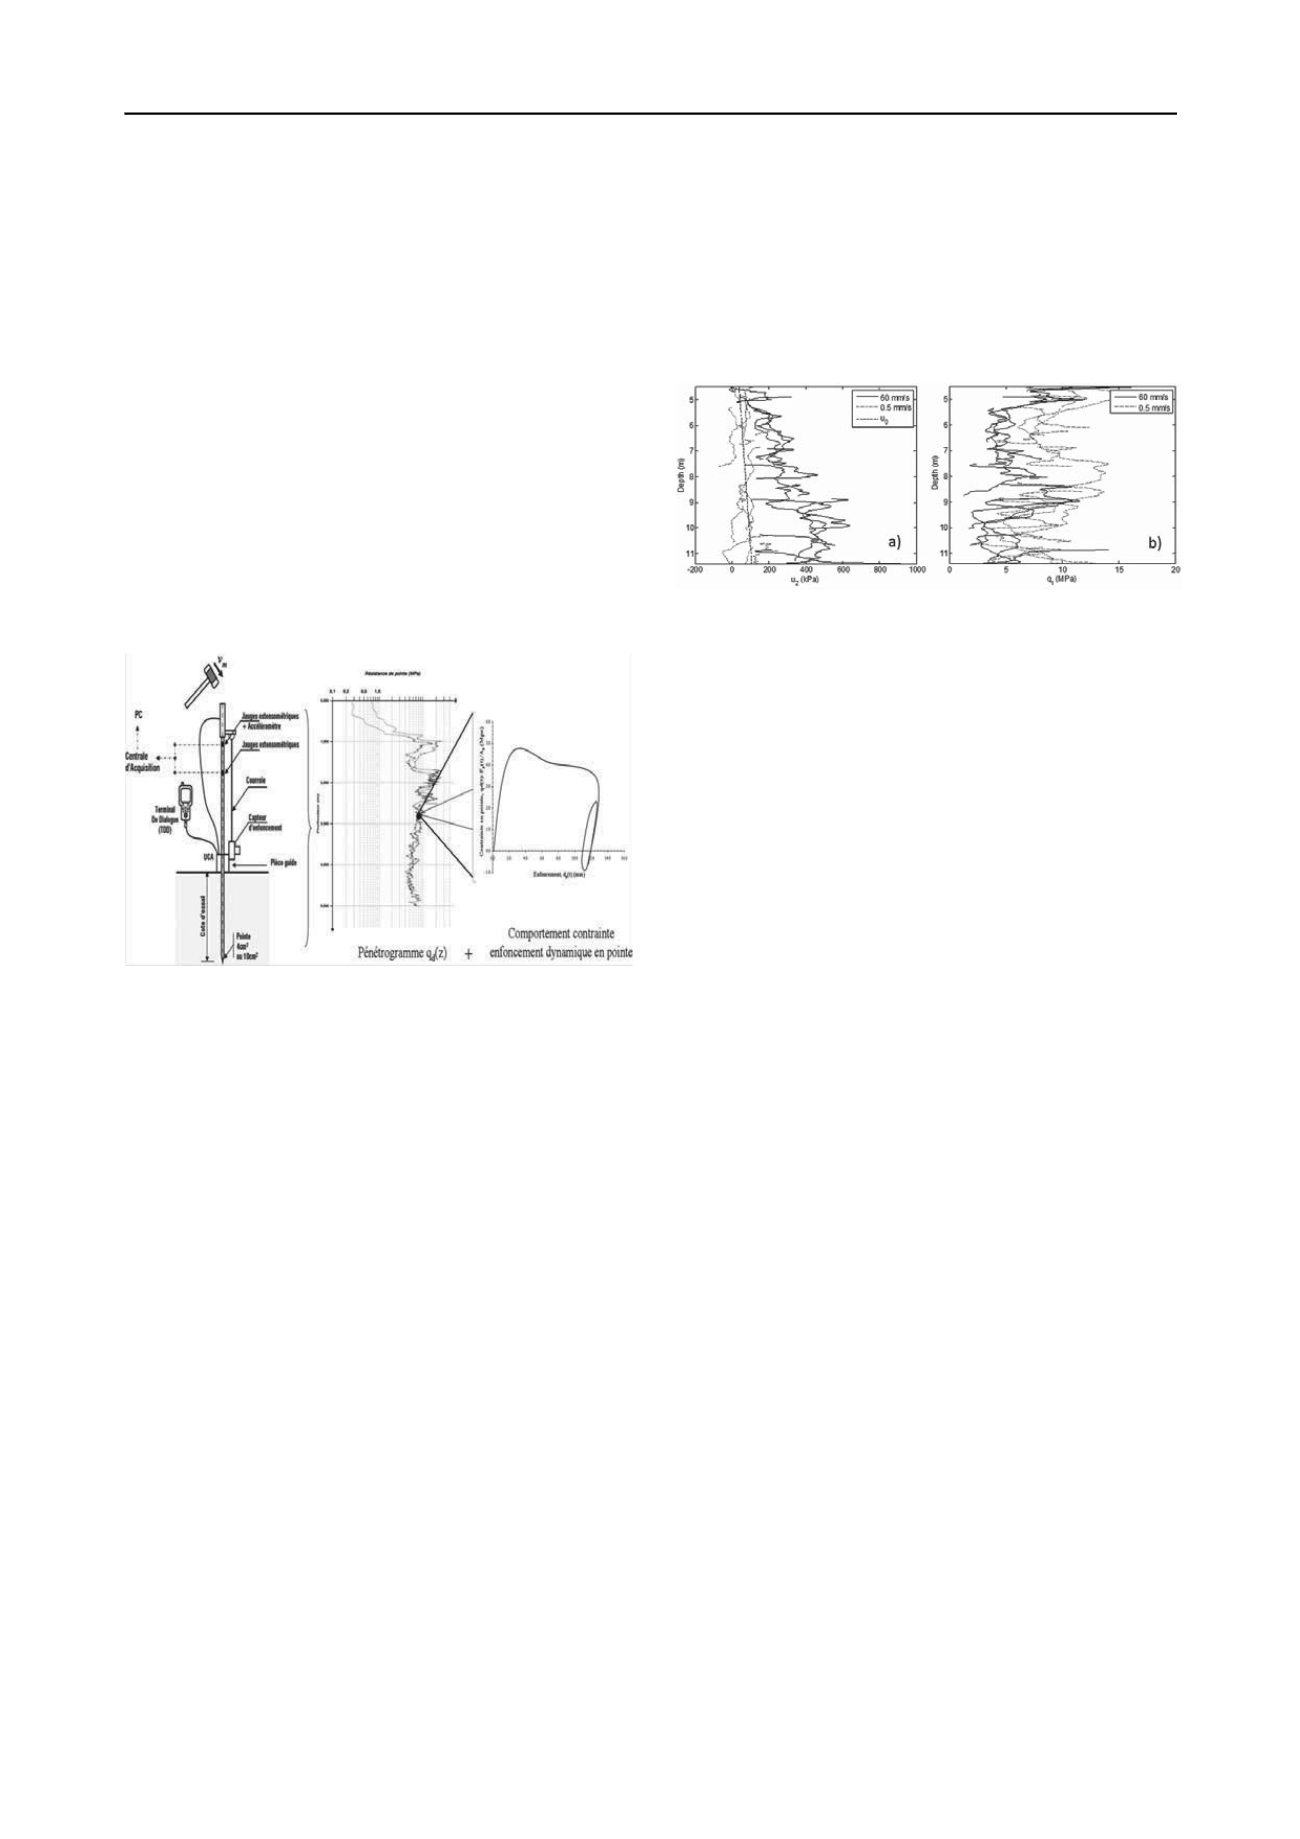
The paper from
Poulsen et al.
shows how a change in cone
penetration rate affects all cone penetration measurements in a
silty soil. The authors emphasized the fact that for the standard
rate of penetration (20 mm/s) it is generally accepted that
undrained penetration occurs in clay, while it is drained in
sands. Data from 15 field cone penetration tests with varying
penetration rates were conducted at a sandy silt test site. Figure
10 depicts the pore pressure and cone resistance at depths
ranging from 4.5 to 11.4 m for CPTs conducted with variable
penetration rates (60 and 0.5 mm/s can be observed). The CPT
conducted with a penetration rate of 0.5 mm/s corresponds to
fully drained penetration conditions, since the measured pore
pressure is close to u
0
. On the other hand, the CPT conducted
with a penetration rate of 60 mm/s corresponds to undrained or
partially drained conditions. The authors did not observe any
correlation between sleeve friction and cone penetration rates.
They concluded that a correlation between the penetration rate,
the cone resistance, and the derived excess pore pressure, do
exist. They have also suggested an approach to determine when
the penetration is partially drained or not, and how to convert it
into a fully drained or undrained condition, hence changing
derived geotechnical parameters.
Figure 10. a) Comparison of the pore pressure and b) cone resistance
carried out with penetration rates of 60 and 0.5 mm/s, with 3 CPTs test
for each rate (
Poulsen et al.
).
Galaa et al. present
a paper describing a methodology for
establishing more representative design values for the hydraulic
conductivity (K) of glacial deposits, particularly when
performing large scale subsurface investigations for tunnels.
They justify their study given the known glacial deposit
heterogeneities and the difficulties to determine proper design
values for K. The authors affirm that conventional pumping
tests can not provide reliable design parameters due to their
small zone of influence, and inherent variable nature of glacial
deposits. Hence, the paper describes a subsurface investigation
which involved 400 boreholes, 88 slug tests and 16 pumping
tests. The authors established a correlation between K from the
field tests (K
field
) and K calculated by the Kozeny-Carman
formula (K
KC
). They observed that the Kozeny-Carmen formula
with the incorporation of a site specific correlation factor
predicted K values ranging between 1/3 to 3 times the K
field
values. The calculated and measured K values were used to
form a statistical analysis of this parameter, and to provide a
more reliable design number for dewatering problems.
Phoon & Ching
present a paper using a statistical approach
for a better interpretation of the geotechnical data when
considering soil variability. The paper presented the concept of
a “virtual site” with the purpose of emulating site investigation
efforts as realistically as possible. The authors affirmed that in
the present time, it is still not possible to emulate every aspect
of a real site deposit. So, the scope was to reproduce the
information content arising from a typical mix of laboratory and
field tests conducted at a site with the aim of estimating
undrained shear strengths (s
u
) for clays and friction angles (
')
for sands. However, the development of a virtual site does not
replace the site investigation need, but it quantifies the
uncertainty in the derived s
u
and
design values by
incorporating into the analyses the effect of either higher quality
or larger numbers of testing results.
Motaghedi et al. present
a new analytical method to predict
cohesion (c) and friction angle (
) using q
c
, u and f
s
from the
piezocone test, considering the bearing capacity mechanism of
failure at the cone tip and a direct shear failure along the
penetrometer sleeve. The authors state that one of the
advantages of this method is the improvement of the accuracy in
the case of (eventually) using erroneous data related to all three
outputs from the CPTu test. The paper presented laboratory test
results, together with two sets of nonlinear equations derived by
the proposed approach and existing correlations for both c and
� parameters. The authors state that the
obtained by current
techniques is relatively higher than real measured values.
However, when adopting the advocated method, the
comparisons indicate a good consistency with lower scatter.


