485
Technical Committee 102 /
Comité technique 102
3)
Normalized sher modulus G/G
0
Damping Ratio D (%)
Spectral
erationSa(g)
accel
second accelerogram “VN_NS” is the strong motion recorded at
the Cascia station (Italy) during the September 19, 1979 Val
Nerina (VN) earthquake (Mw = 5.8, on outcrop, normal fault,
site-source distance ≈ 9 km), scaled to the same peak ground
acceleration of UM earthquake.
3.2
Geotechnical model
The geotechnical model of Chieti hill, used in the numerical
analyses, is illustrated in Figure 1 and 3 and Table 1, by includ-
ing the soil and dynamics parameters (unit weight γ, Poisson
coefficient ν, shear wave velocity
V
S
, stiffness decay curves
G/G
0
and damping
D
curves).
an average value interpolated from the experimental relation-
ship Crespellani et al. (1989) and SDMT profiles.
The site campaign of the Justice Court had provided only a cy-
clic simple shear tests with double sample in OC silty clay. In
this respect, the following reference laboratory curves were as-
sumed to evaluate the non-linear and dissipative soil behaviour:
Anh Dan et al. (2001) for filling material, Marcellini et al.
(1995) for sand and sandstone, MS–AQ Working Group (2010)
for silty clay colluvial cover. The bedrock has
G/G
0
- γ and
D
– γ
linear behaviour.
3.3
Results
1D numerical analyses of seismic site response were carried out
1
0.8
0.6
0.4
0.2
0
1,2 - Fillingmaterial
4,5 - San d ,Sandstone
6 - OC Silty clay
7 - OC Silty clay
3 - Silty clayco lluvialcover
1,2 - Fillingmaterial
4,5 - San d ,Sandstone
6 - OC Silty clay
7 - OC Silty clay
18
by considering the Northern portion and the Southern portion.
16
The spectral accelerations (Figure 4) highlight the different me-
14
chanical behaviour of the upper 8 meters: the Southern portion
12
shows pronounced amplifications for a period of 0.1-0.2 s, that
10
is the fundamental period of the filling material, while the spec-
8
tral accelerations of Northern portion appear lower.
6
2D numerical analyses of seismic site response were performed
4
by considering in the Southern portion two point, A and B, 20
2
m far from each other, shown in Figure 3. The peak ground ac-
celerations (Figure 5) doesn’t appear influenced by spatial posi-
0
0.0001
0.001
0.01
0.1
1
Shear Strain (%)
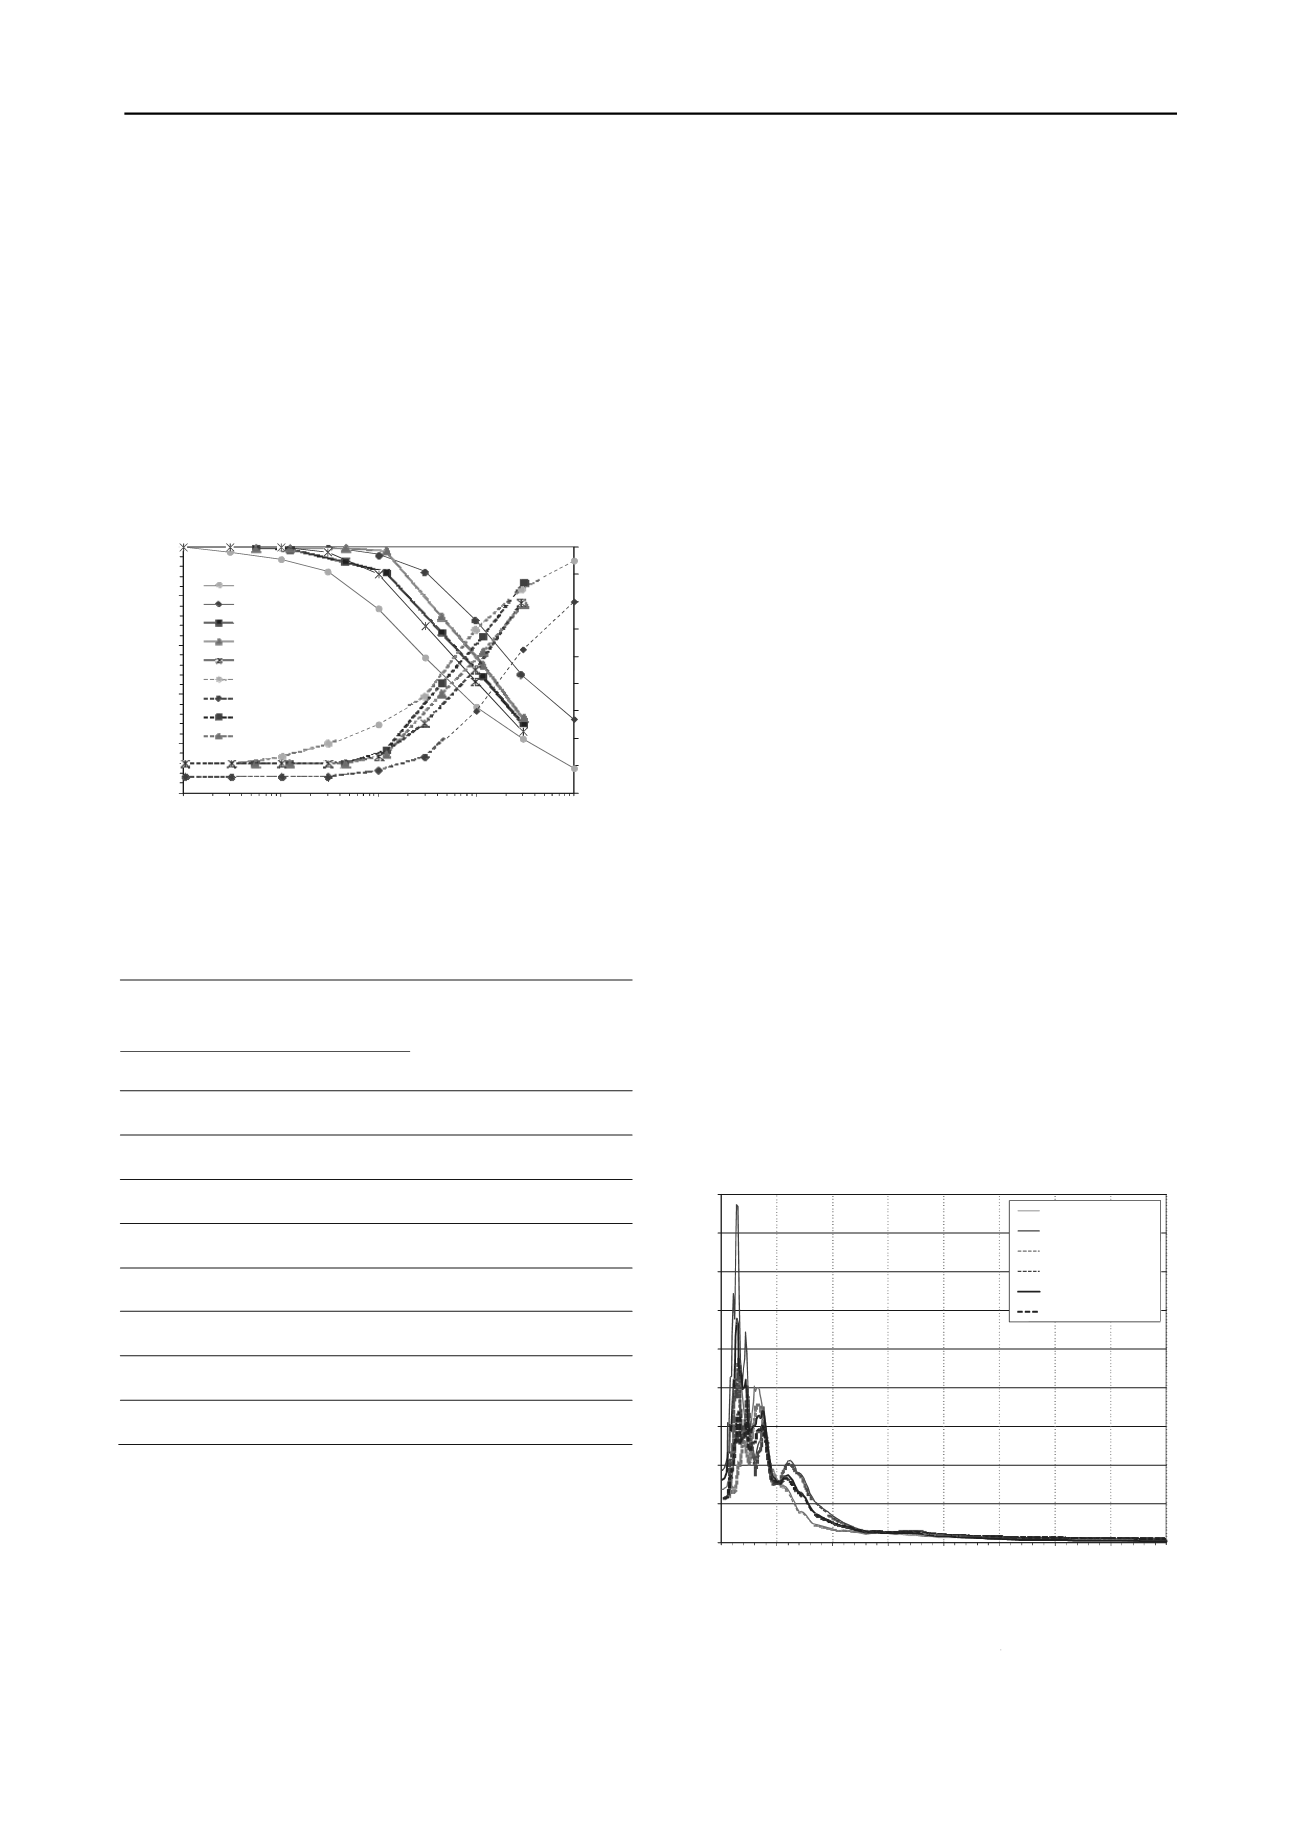
Figure 3. Stiffness decay curves
G/G
0
and damping
D
curves of
Chieti hill for numerical analyses.
Table 1. Geotechnical model of Chieti hill for numerical analyses.
tion and input ground motion, even thought the analyses con-
sider only two time histories. In addition, the spectral
accelerations emphasize the site effect due to the topography:
point A, closer than point B to the hillside, shows higher ampli-
fications for a period of 0.2-0.4 s, compared to the ones of point
B .
The comparison of the average results from 1D and 2D numeri-
Layer
Material
γ
ν
V
S
cal analyses in the Southern portion of the Justice Court (Figure
6) illustrates that the 1D peak ground accelerations are higher
(kN/m
(m/s)
than the ones evaluated from 2D analyses, probably due to the
1
Filling material
17.1
0.30
220
2
Filling material
17.1
0.30
440
3
Silty clay colluvial cover 18.7
0.45
280
higher sensitivity of 1D model to stratigraphic effects. In addi-
tion, 2D method shows local site effects mainly due to topogra-
phy for a period of 0.3-0.4 s, that is the fundamental period of
the Justice Court.
4
Sand, sandstone
20.6
0.30
580
5
Sand, sandstone
20.6
0.30
870
1.8
1.6
UM_EWSouthernportion1D
VN_NSSouthernportion1D
UM_EWNorthernportion1D
6
OC silty clay
20.2
0.45
600
7
OC silty clay
20.2
0.45
800
8
Bedrock
21.0
0.30
1000
9
Bedrock
22.0
0.30
1300
1.4
1.2
1.0
0.8
0.6
VN_NSNorthernportion1D
AverageSouthernportion1D
AverageNorthernportion1D
On the top of the hill, in correspondence of the Justice Court, the
subsoil was modelled by considering in the upper 8 m filling
material in the Southern portion of the Justice Court and sand
and sandstone in the Northern portion, sand and sandstone be-
tween 8 m and 42 m of depth, OC silty clay between 42 m and
342 m of depth and the bedrock beyond 342 m of depth, while on
the hillside the model reflects the silty clay colluvial cover in the
upper 15 m up to the OC silty clay layer. In the upper 50
meters the
V
S
profile was defined as an average of SDMT pro-
files, while in the lower OC silty clay
V
S
was estimated by using
0.4
0.2
0.0
0.0
0.5
1.0
1.5
2.0
2.5
3.0
3.5
4.0
PeriodT (s)
Figure 4. Spectral accelerations form 1D analyses.


