484
Proceedings of the 18
th
International Conference on Soil Mechanics and Geotechnical Engineering, Paris 2013
the base level is at about 4.90 m in depth. Then, before inter-
cepting sandy and arenaria deposits, it was found a landfill layer
from 4.90 to 8.00 m. In terms of stiffness it means that in the
Northern portion of the structure the foundations stand on soil
with higher mechanical properties compared the soil in the
Southern part. A possible solution to restore the historical build-
ing is to improve the stiffness of the soils placed in the Southern
portion, without acting on masonry foundations. This achieve-
ment could be realized for example, using, from 4.90 to 8.00 m
in depth, special injections at low pressure, able to penetrate and
mix with the existing soil structure.
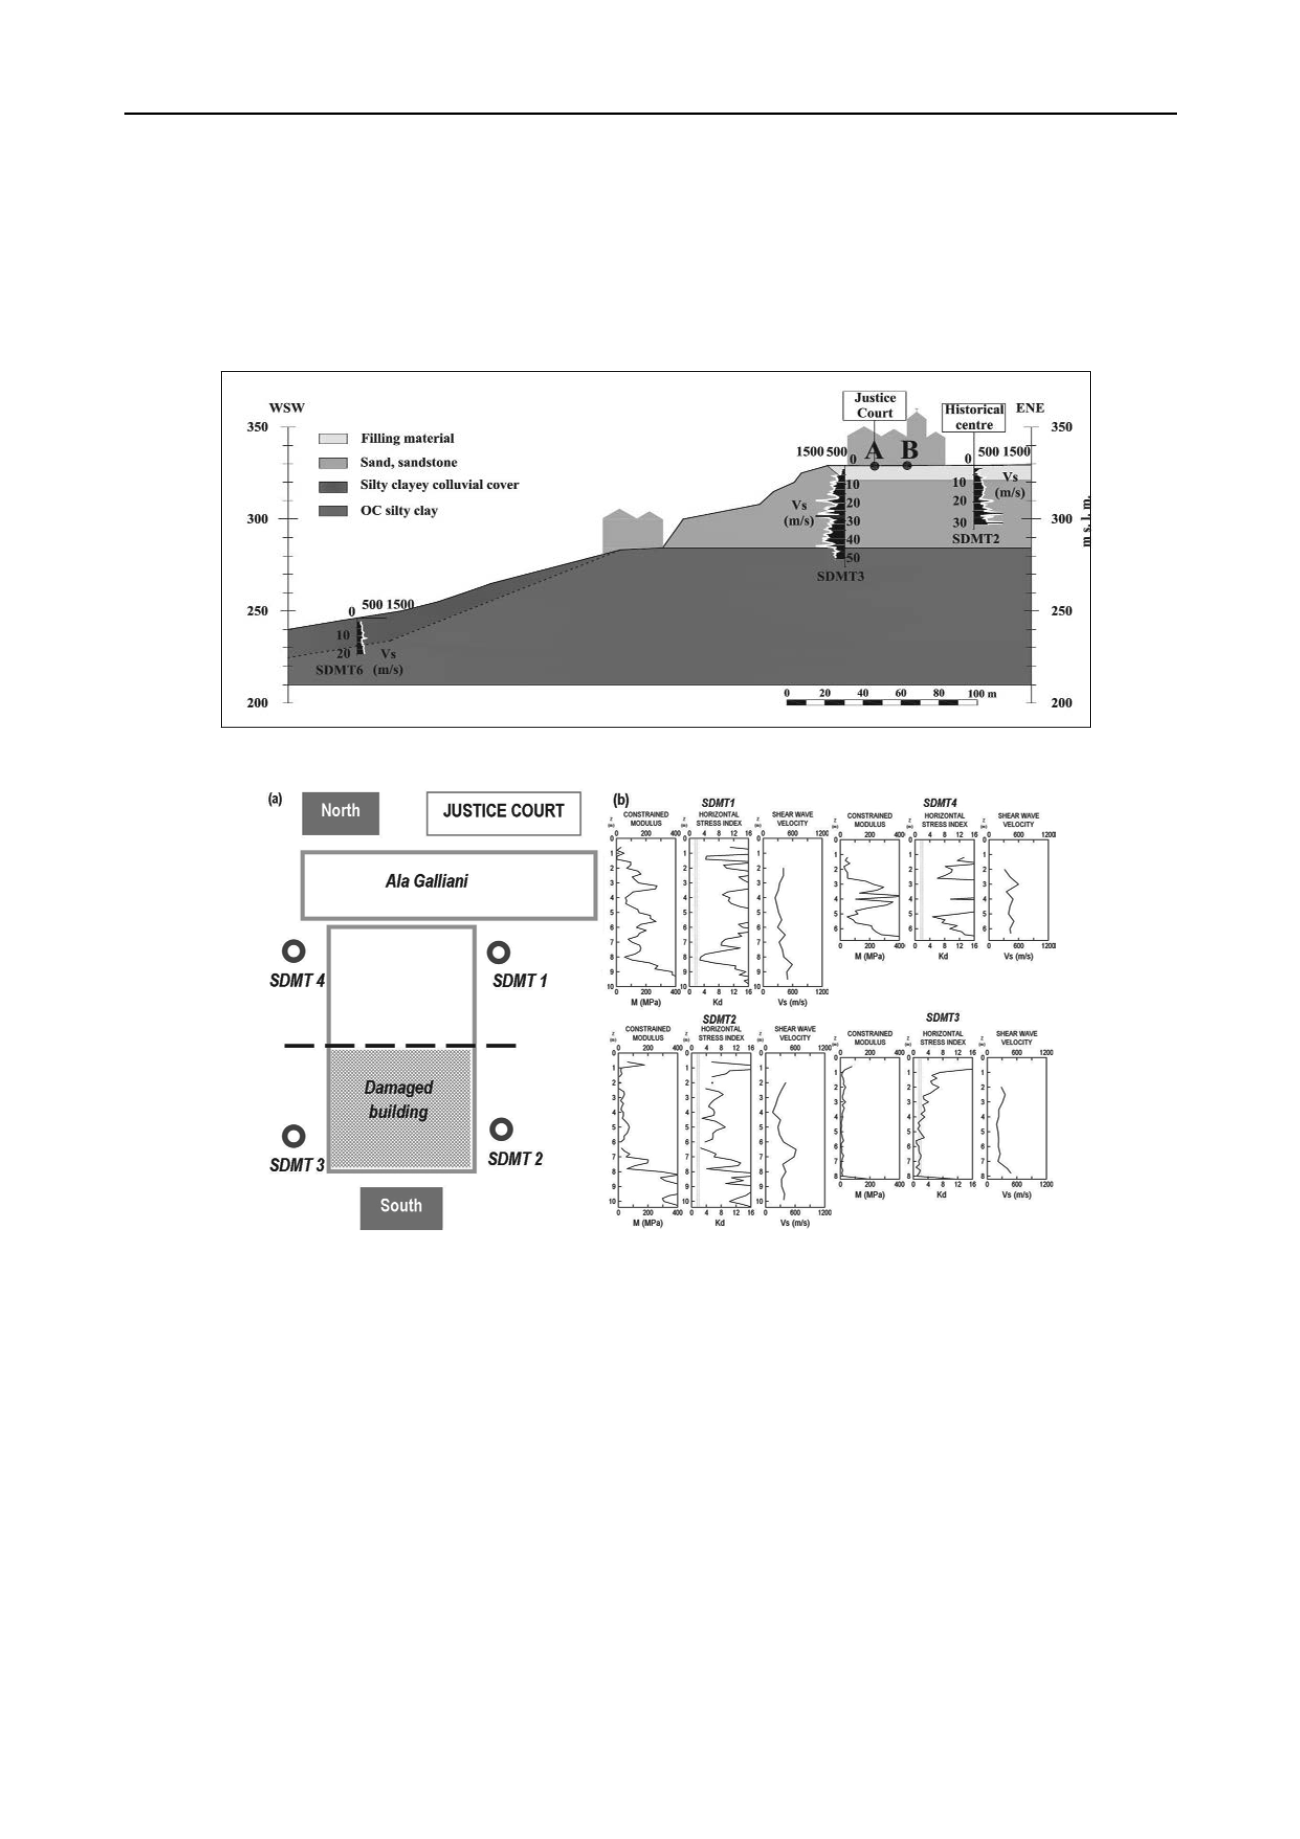
Figure 1. Geotechnical cross section with
V
S
profiles.
Figure 2. (a) Justice Court: site investigation by Seismic Dilatometer; (b) SDMT results:
M
,
Kd
and
V
S
profiles.
son was carried out between the Northern portion (absence of
filling material) and the Southern portion (presence of filling
3 SITE RESPONSE ANALYSIS
Numerical analyses of seismic site response were carried out us-
ing the computer codes EERA (Bardet et al. 2000), a monodi-
mensional linear equivalent model, and QUAD4M (Hudson et
al. 1994), a bidimensional linear equivalent model. that consid-
ers a cross section of 3.5 km of width, with 5860 elements and
5844 joints.
The evaluation of the local site effects (e.g. topography, soil
conditions) plays an important role in the non-uniform amplifi-
cation response obtained at different sites (Paolucci 2002).
In order to compare the 1D and 2D analyses, the 1D elastic re-
sponse spectrum were multiplied by the topographic amplifica-
tion factor, assumed equal to 1.2 (CEN 2003). Both the analyses
were performed on the top of Chieti hill, in correspondence of
Southern portion of the Justice Court. Moreover, a 1D compari-
material) to evaluate the site effects due to the different me-
chanical behaviour of the upper 8 meters.
3.1
Input ground motions
For the numerical analyses two natural accelerograms, applied
on the bedrock, were selected as input ground motions. Both the
accelerograms were chosen from the software REXEL (Smerz-
ini et al. 2012) and the Italian Accelerometric Archive ITACA
(Working Group ITACA 2010).
The first accelerogram “UM_EW” is the strong motion recorded
at the Assisi station (Italy) during the September 26, 1997 Um-
bria-Marche (UM) earthquake (Mw = 6, on outcrop, normal
fault, site-source distance ≈ 20 km), scaled, according to CEN
(2003), to a peak ground acceleration of 0.164g, for a return pe-
riod TR = 475 years and a soil type, for the site of Chieti. The


