458
Proceedings of the 18
th
International Conference on Soil Mechanics and Geotechnical Engineering, Paris 2013
preferential orientations could be expected. Generally speaking,
by adopting this approach particles will have their long axis
roughly perpendicular to the gravity field direction (Yan and
Zhang 2013). Another approach is used to create assemblies of
particles having random orientations. In this case, particles with
random orientations are generated inside the model container
and numerical iterations are allowed to achieve an equilibrium
of the assemblage.
A square assemblage having 80 mm in each side is then
extracted from the model container as shown schematically in
Figure 1. An isotropic confining pressure is applied to the
boundary walls of the specimen right after the body force field
is turned off. Isotropic pressure of three different magnitudes is
modeled: 50, 100 and 200 kPa. Attempts are made by
controlling the inter-particle friction coefficient and selecting
appropriate location of the square such that specimens confined
at the same pressure show essentially identical void ratios but
different initial fabrics prior to shear. The difference in void
ratio in all cases is less than 0.0006.
A specimen is labeled by its initial stress, details of specimen
generation method and void ratio prior to shearing. For instance,
I100D90_219 denotes a specimen confined at 100 kPa, formed
by depositing particles from a direction perpendicular to (i.e.,
90°) to the major principal stress direction and had an initial
void ratio of 0.219 before shearing. By the same token,
I50Ran_219 represents a specimen confined at 50 kPa, having
an initial void ratio of 0.219 with particles generated with
random orientations.
To simulate a constant lateral stress biaxial compression, the top
and bottom walls are moved simultaneously and slowly inwards
while the horizontal position of the left and right lateral walls is
continuously adjusted according to a servo-controlled
mechanism to keep the lateral confining pressure at the initial
value. It is to ensure that a quasi-static equilibrium is
maintained throughout the analysis. A compression strain rate
of 2.5×10
-5
% per computational step is used and all the
specimens are sheared to 80% axial strain.
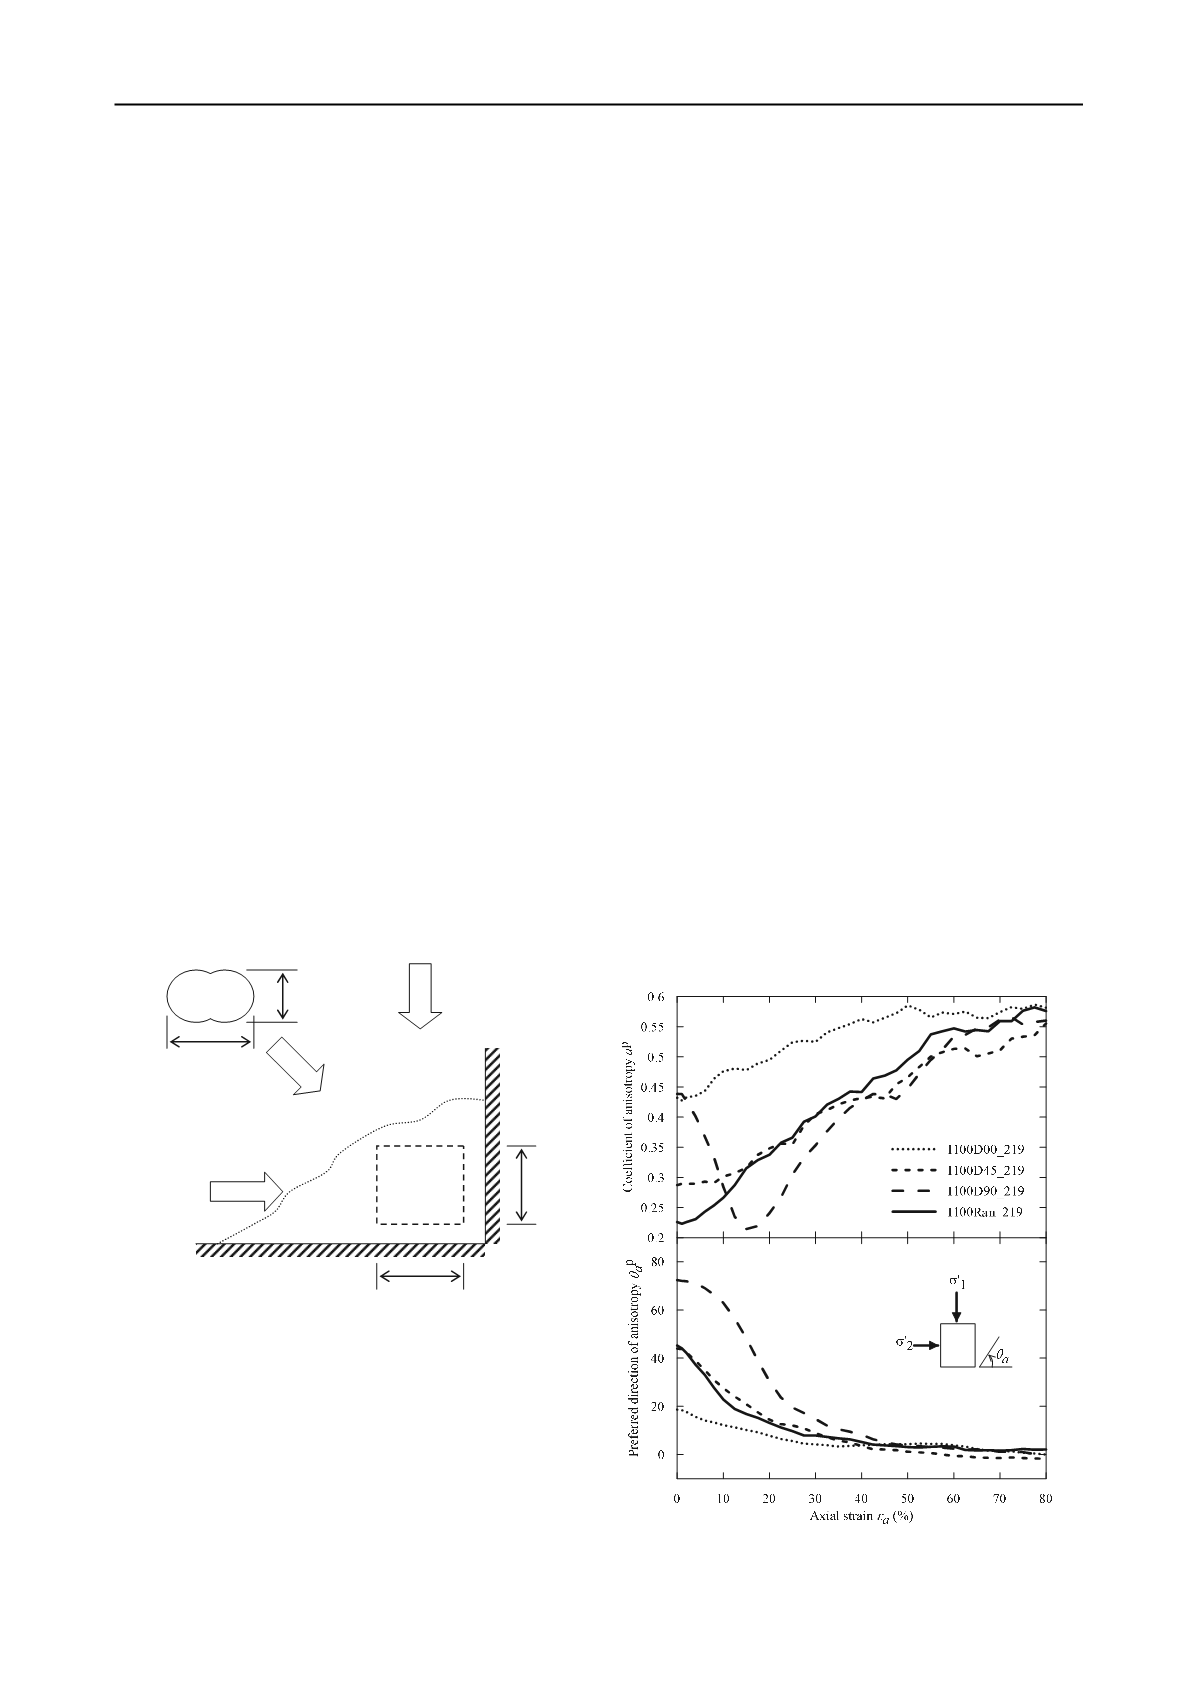
Figure 1. Specimen generation.
3 PARTICULATE FABRIC
Following the pioneer work presented by Oda et al. (1985),
three major sources of fabric are considered in the study. They
are (i) particle orientation, (ii) contact normal; and (iii) void
distribution which are denoted by superscripts p, fn, and v
respectively. Directional information of each fabric parameter is
represented statistically by a rose diagram (Yan and Lin 2013).
Two scalar quantities,
a
and
a
are used to describe the
distribution density
f
n
of the fabric (Rothenburg 1981, see
Equation (1)).
1 cos 2
/ 2
a
f
a
n
(1)
where
n
is a unit vector,
a
is called the coefficient of
anisotropy that characterizes the degree of anisotropy and
0
180
a
describes the preferred direction of the
anisotropy given that
d 1
f
n n
. Clearly 0
a
indicates an
isotropic distribution and the degree of anisotropy increases
with
a
. In this study,
0
a
denotes a direction perpendicular
to the major principal stress. Details of the fabric description
could be found in Yan and Zhang (2013).
4 RESULTS
4.1
Influence of initial fabric
This paper focuses on the evolution of fabric, in particular the
particle orientation and void space, during biaxial shearing. The
stress-strain-strength behavior of the assemblages is not shown
due to the page limitation. It is found that the stresses and
volumetric strain become essentially steady beyond 60% axial
strain. Figure 2 and 3 show the evolution of the fabric of
specimens having identical initial density but different initial
fabric. As shown in Figure 1, specimens having different initial
particle orientations have been created by different methods of
generation. Specimens generated by the particle deposition
method generally show an average particle orientation highly
correlated to the deposition direction. For instance specimen
I100D90_219 shows
70
p
a
before shear, which indicates
that the particles tend to align with its long axis perpendicular to
the deposited direction (D90). Specimens generated by the
deposition method exhibit a higher initial degree of anisotropy
as compared to the one with particles randomly generated. Upon
shearing, particles gradually rearrange in a way that their long
axis becomes perpendicular to the principal stress direction (i.e.,
the shearing direction). Furthermore, a unique fabric of very
similar pair of
p
a
and
p
a
is shown at large strains (
p
0.55
a
and
p
0
a
).
Figure 2. Evolution of particle orientation fabric
–
the influence of
initial fabric.
80 mm
80 mm
D00
D45
D90
particl
1.5 mm
1 mm
Not to scale


